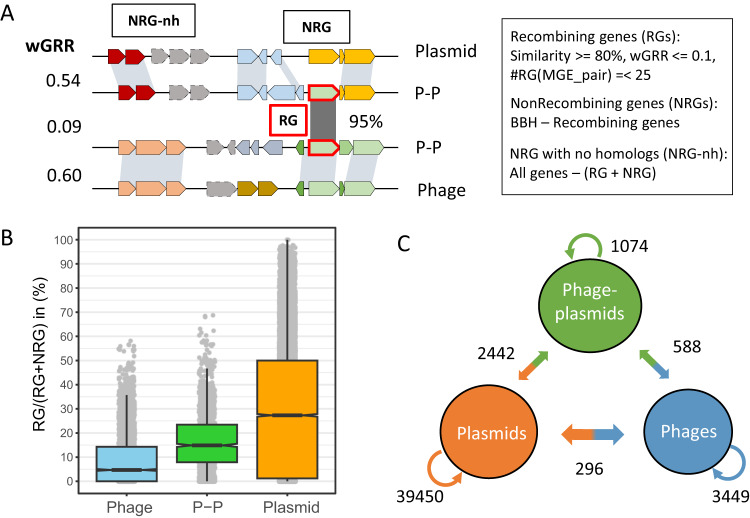
Fig. 2. Gene flow between phages, plasmids and phage-plasmids.
A Allocation of genes from MGEs into recombining (RG), non-recombining genes (NRG) and NRGs with no homologs (NRG-nh). B The box-plot represents the frequency of RG (relative to the sum RG plus NRG) in MGEs (n(P-P) = 1416, n(Phage)= 3575 and n(Plasmid)=20,057). In the box plot (notch style), the whiskers mark the 1.5 inter quantile length from the 1st (box bottom line) to the 3rd (box top line) quantile. Of note, a few phages and plasmids do not have RGs or NRGs (but only NRG-nh), and were excluded. C The numbers on the arrows represent the number of RG families with at least one such type of exchange (e.g., at least one exchange between plasmids in orange or between phages and plasmids on the orange to blue arrow).

