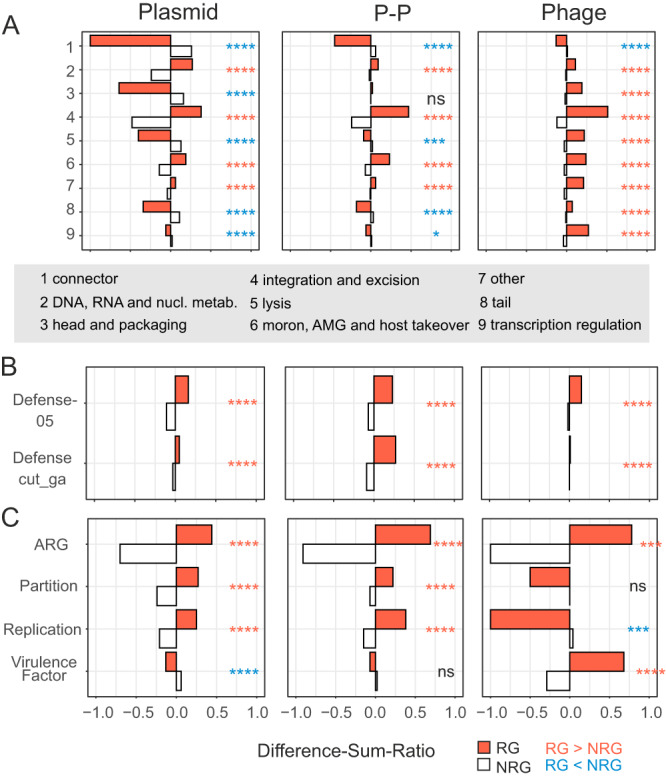
Fig. 3. Functions enriched or depleted among recombining genes (RGs).

A–C RGs were annotated using different databases (see “Methods”, auxiliary metabolic genes (AMGs)). The numbers of RGs per category and type of mobile elements were compared to the number of non-RGs (NRGs) using a one-sided Fischer’s exact test with the Benjamini-Hochberg correction. The tests were two-tailed and when RGs were significantly different from NRGs this was marked by red stars if their frequency was larger and by blue stars if their frequency was smaller than that of NRG. Panels are organized in the way in which the groups were tested (to guarantee independency). In particular, genes assigned to multiple categories were not tested together, e.g. genes annotated by Defense and DNA metabolism (of PHROGs). Genes with no matches to any profile or database are not shown but were included in the tests and their numbers are listed in Supplementary Dataset S5, including all p values of all conducted tests. Difference-sum ratios were computed (see “Methods”) as the ratio of the difference between observed and expected over the sum. pvalue: ns >0.05, * <=0.05, ** <= 0.01, *** <=0.001, **** <= 0.0001. A Genes were annotated by PHROG profiles. Numbers in the y-axis represent categories that are listed in the gray box. B Gene annotation was done by profiles taken from DefenseFinder79 (see “Methods”). C AMRFinderPlus80, VFDB83 and profiles matching plasmid partition and replication functions were used to annotate RGs and NRGs.
