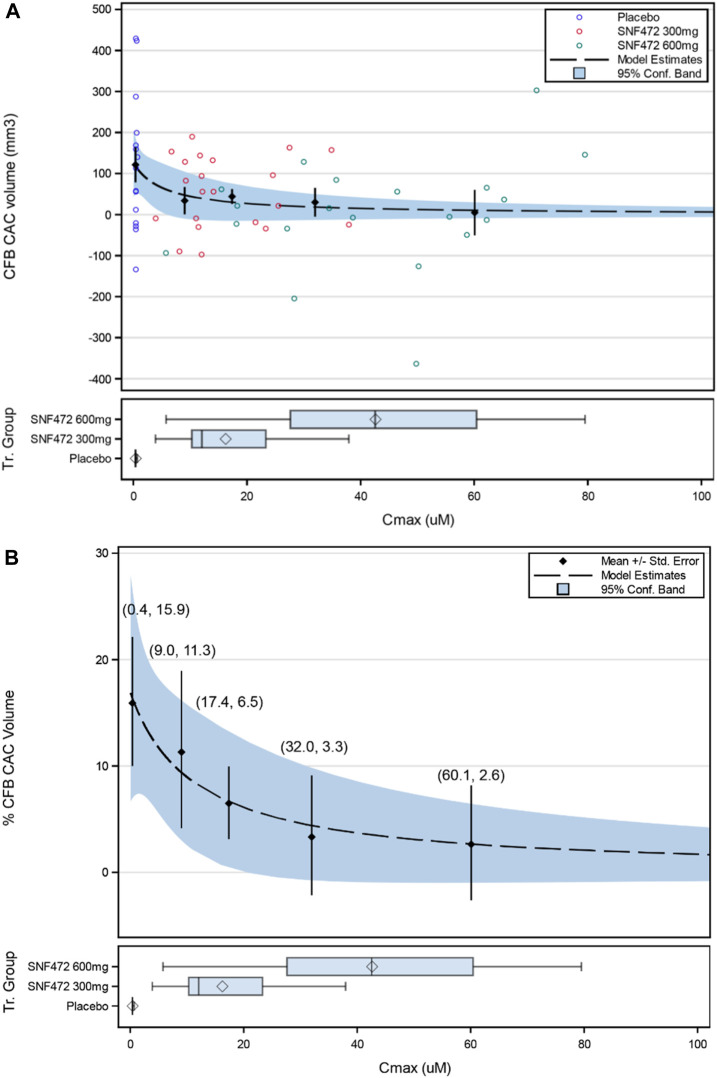
FIGURE 4.
Simple Emax Model for the Relation of Average Cmax Over 52 Weeks on Percentage Change from Baseline in Coronary Artery Calcium (CFB CAC) Volume (Back-transformed Values): (A) Individual Values; (B) Mean Values (±SE). Values in parentheses are (quartile average Cmax, %CFB CAC). Box Plot display: diamond represents the arithmetic mean, vertical line represents the median, central rectangle spans the first quartile to the third quartile (the interquartile range), and whiskers show the locations of the minimum and maximum.

