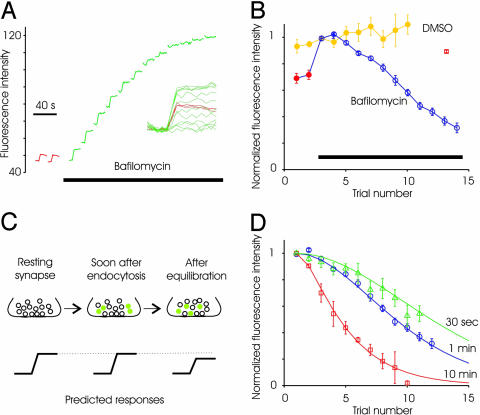
Fig. 3.
Recruitment of reserve vesicles during multiple spaced stimuli. (A) Average spH responses to successive stimuli (40 APs, 20 Hz) delivered before (red) and after (green) addition of bafilomycin. The plot of absolute fluorescence intensity (after background subtraction) demonstrates several points: the lack of acidification after addition of bafilomycin, the slight spontaneous alkalinization between trials, and the progressive loss of evoked response. (Inset) All of the trials plotted with each baseline subtracted. (B) Average evoked response for successive trials before and after addition of bafilomycin (n = 9 experiments, at least 50 boutons each). Waiting time between trials was 1 min. Control responses after addition of just DMSO indicates no significant change in response size (n = 5 experiments). The response decays only slightly if the waiting time between the first and second trials in bafilomycin was 10 min (red square). (C) Schematic of the predicted outcome if mixing occurs between the RRP and reserve pool over a time scale of several minutes. (D) When the waiting time between trials was increased to 10 min, responses decline more rapidly (□, n = 5). When time interval between trials was reduced to 30 s, the response decay was similar to the 1 min waiting time (n = 4 experiments). Continuous lines are arbitrary polynomial functions showing trends in the data.

