Figure 1.
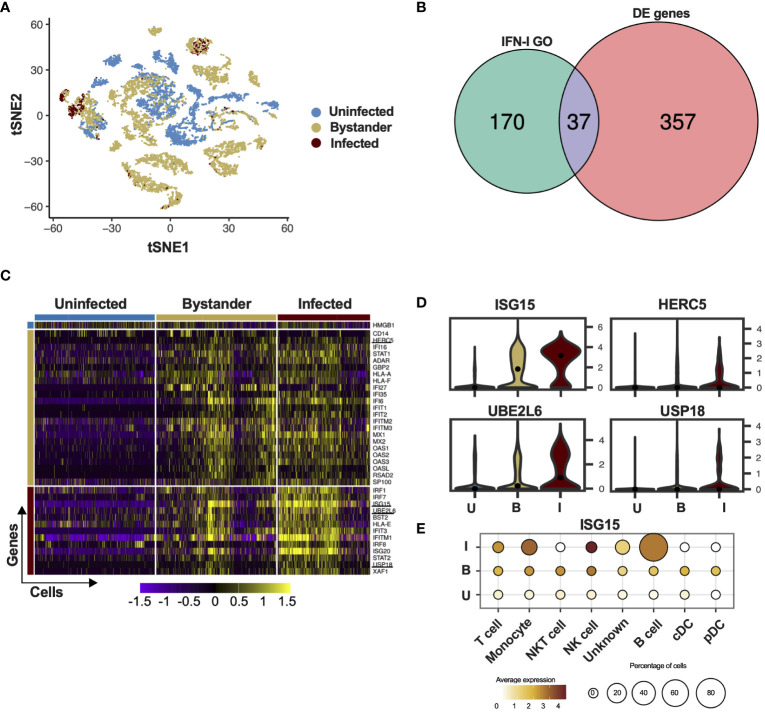
ISG15 is expressed in DV-infected PBMC. (A) tSNE was used to visualize the single-cell global transcriptome data. Blue dots represent uninfected cells, derived from healthy donors. Beige dots represent bystander cells and red dots represent infected cells, both derived from patients infected with DV. (B) Differential expression of ISGs in PBMCs of patients infected with DV. The Gene Ontology term “type one interferon” was used to filter the results from the single-cell RNA sequencing. (C) Single cell ISG expression variability in uninfected, bystander and infected. ISGylation related genes are underlined. Blue bar represents uninfected cells, derived from healthy donors. Beige bar represents bystander cells and red bar represents infected cells, both derived from patients infected with DV. (D) Violin plot representing the expression of ISGylation family members in uninfected [U], bystander [B] and infected [I] PMBC. The adjusted p-values are 1.82e-62 for ISG15 (I); 6.91e-25 for UBE2L6 (I); 1.05e-23 for USP18 (I) and 5.05e-217 for HERC5 (B). (E) Expression of ISG15 in DV infected PMBCs. Size is proportional to the percentage of infected cells in each cell type. Color intensity represents ISG15 average expression.

