Figure 4.
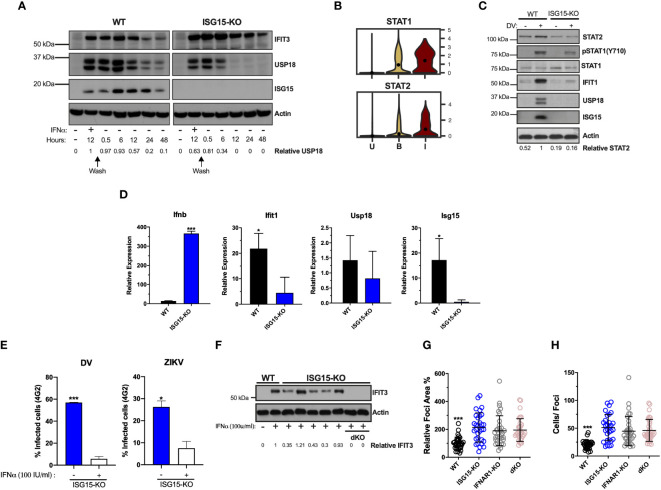
ISG15 is necessary for autocrine IFNAR1-mediated control of DV replication. (A) A549 cells were primed with IFNα2b (100 IU/ml) for 12 h, washed three times with DPBS and allowed to rest. Cells were harvested at the indicated time point and cell lysates were analyzed by Western blot with the corresponding antibodies. Results are representative of two independent experiments. (B) Violin plot representing the expression of STAT1 and STAT2 in uninfected [U], bystander [B] and infected [I] PMBC. Adjusted p-values, STAT1 p=0 and STAT2 P =1.34e-22(I) (C, D) A549 cells were infected with 20 DV PFU. At 36 hpi, cells were harvested, cell lysates were analyzed by immunoblotting (C) and the indicated mRNA transcripts were quantified by RT-qPCR (D). Error bars represent mean ± SD. Results are representative of two independent experiments. Data was analyzed by unpaired t test. (E) A549 ISG15 KO cells were primed with IFNα2b (100 IU/ml) for 12 h, washed three times with DPBS and allowed to rest 12 h before infection with DV or ZIKV at an MOI of 0.1. Shown is the percentage of cells infected at 36 hpi, as measured by E protein staining (4G2+). Error bars represent mean ± SD. Results are representative of three independent experiments. Data was analyzed using unpaired t test. (F) Different clones of A549 ISG15 KO and ISG15/IFNAR double KO cells were immunoblotted for IFIT3 after 24 h treatment with IFNα2b (100 IU/ml). (G, H) A549 cells were infected with 20 DV PFUs. At 36 hpi cells were fixed, permeabilized and stained for the flavivirus E protein. DV relative foci area (G) and number of infected cells per foci (H) quantified by ImageJ software and analyzed by one-way ANOVA. Images were acquired with an Olympus IX83 inverted microscope. Error bars represent mean ± SD. Results are representative of three independent experiments. Statistical analyses were performed using Prism 8 (GraphPad Software). p values *<0.05; ***<0.001.

