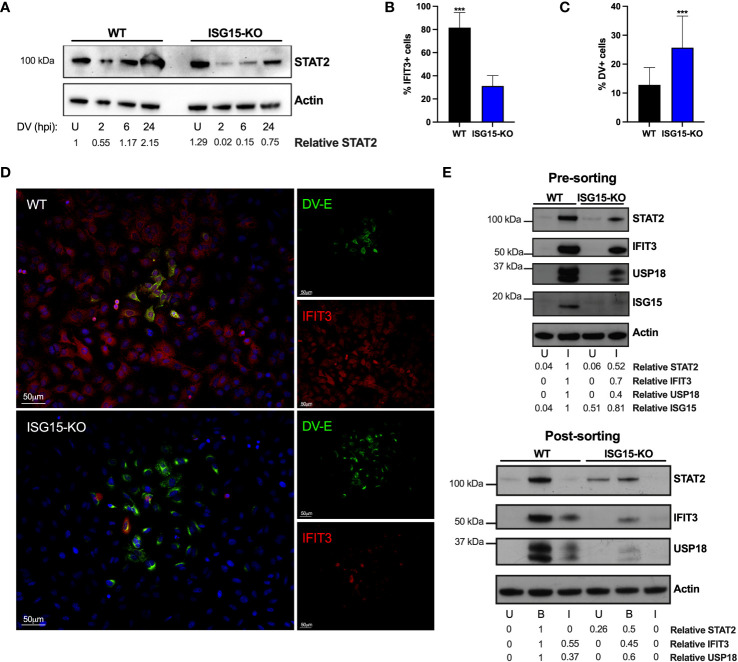
Figure 5.
ISG15 counteracts DV IFN-I evasion. (A) A549 WT and ISG15 KO were infected with 20 DV PFU. Cells were harvested at the indicated time points after infection (hpi) and cell lysates were analyzed by Western blot using STAT2 and Actin antibodies. (B–D) A549 WT and ISG15 KO immunofluorescence assay (IFA) 36 hpi for cellular IFIT3 and flavivirus E protein expression (D). Percentage of IFIT3 (B) and DV (C) positive cells per foci were quantified by ImageJ software and analyzed using unpaired t test with Welch’s correction when appropriate. Displayed images were acquired with a Leica DMI6000 B microscope. (E) A549 cells were infected with DV at MOI 0.01. At 36 hpi, cells were fixed, permeabilized and stained for flavivirus E protein. Cell lysates were analyzed by Western blot with the indicated antibodies before (upper panel) and after (bottom panel) cells were sorted by fluorescence-activated cell sorting (FACS) based on E protein expression. U, uninfected; B, bystander; I, infected. Error bars represent mean ± SD. Results are representative of two independent experiments. Statistical analyses were performed using Prism 8 (GraphPad Software). p values ***<0.001.

