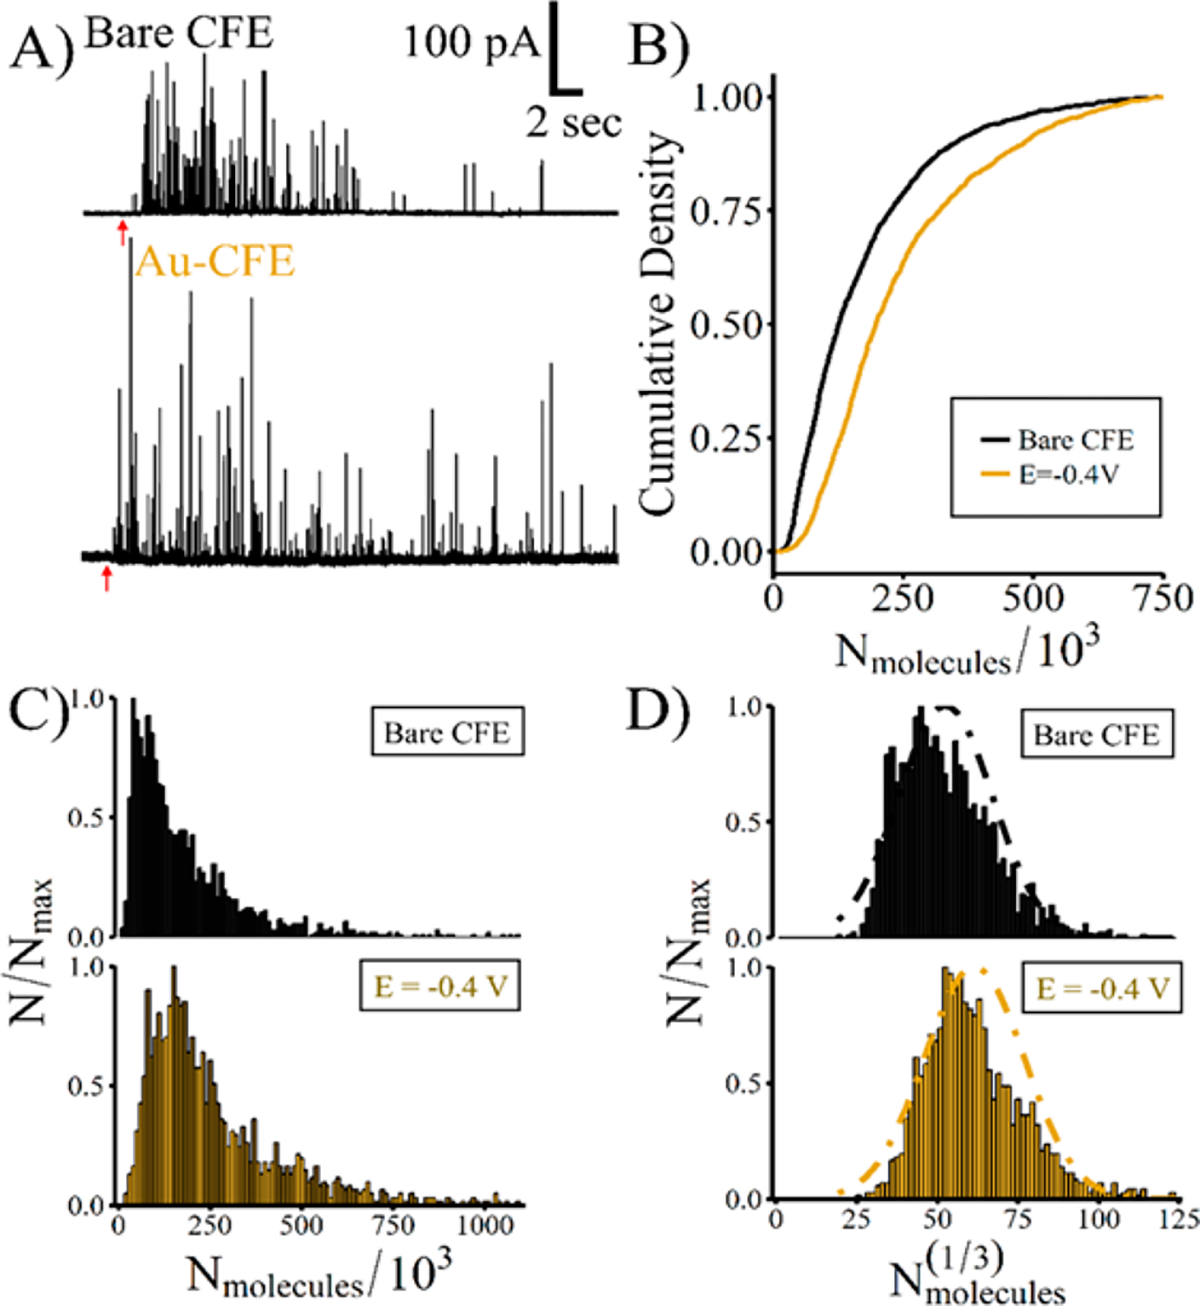
Figure 5.

Au-CFEs detect more catecholamine release from L-DOPA-augmented PC12 cells. (A) Example traces collected from bare CFEs or Au-CFEs. The red arrow indicates stimulation. (B) Cumulative density distributions of the number of molecules released show Edeposit = −0.4 V‡ is significantly different from bare CFEs (KS test, ‡ = p < 0.0001). (C) Normalized frequency histograms of the number of molecules released. (D) Normalized frequency histogram of the cube root of the number of molecules for each electrode type.
