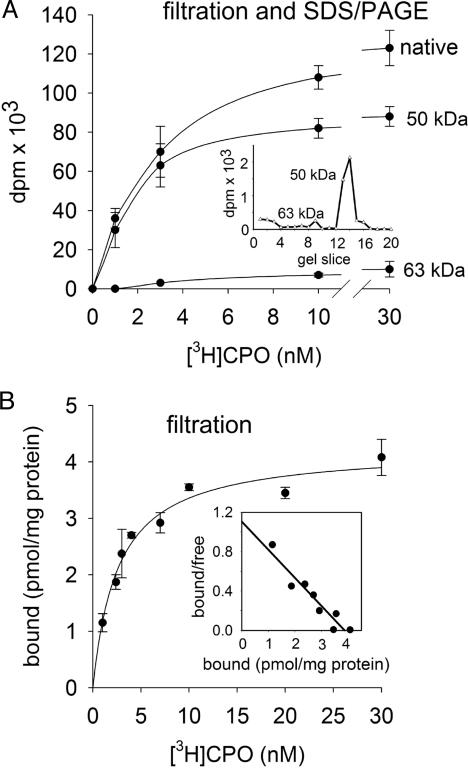
Fig. 1.
[3H]CPO labeling of mouse brain membranes analyzed by filtration assay of the 100,000 × g pellet (native membranes) and by SDS/PAGE (50- and 63-kDa proteins). Membranes (200 μg of protein) were incubated for 15 min with [3H]CPO at 1 nM (A Inset shows labeled 50- and 63-kDa proteins) or 1-30 nM. Data in B are shown as binding isotherm (mean ± SD, n = 3) and pseudoScatchard plot (r2 = 0.91) (Inset).

