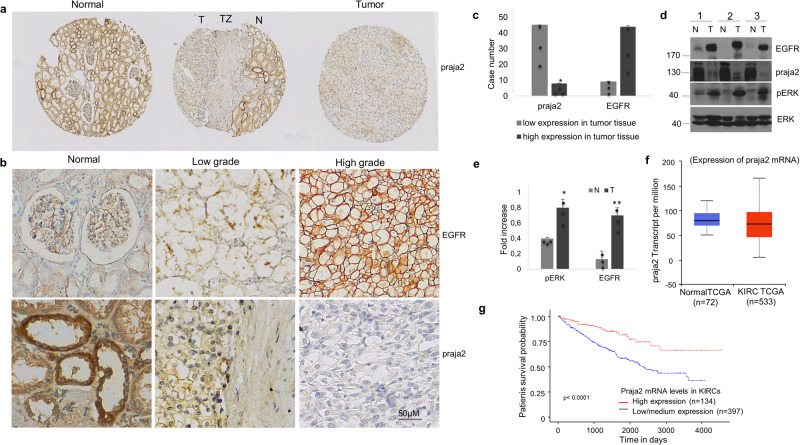
Fig. 4. Loss of praja2 in high-grade kidney cancer.
a Immunohistochemistry analysis of praja2 in normal renal tissue and renal tumor lesions. The middle section shows immunostaining for praja2 at the transition zone (TZ) between normal (N) and tumoral (T) areas. Magnification 40×. b Immunohistochemistry analysis for praja2 and EGFR. Normal tissue, low-grade tumor, and high-grade tumor are shown. EGFR expression is low in normal renal tissue and increased in clear cell renal cell carcinomas in a variable manner (upper panels). Inversely, praja2 expression is high in normal tissue and strongly decreased in tumors (lower panels). c Quantitative analysis of experiment shown in (b). d Immunoblot analysis of praja2, EGFR, and phosphorylated ERK1/2 in total lysates prepared from ccRCC human tissues. e Quantitative analysis of experiment shown in (d). A mean value of three experiments ± SD is presented. Student’s t-test for EGFR, *P = 0.002; Student’s t-test for pERK1/2 *P = 0.014 (f) Boxplot showing relative expression (RNA transcript per million) of praja2 in normal samples and in primary lesions of kidney renal clear carcinoma (KIRC). UALCAN Database and Statistical Analysis Student’s t-test were used (P ≤ 0.01). g Kaplan–Meier plots showing the association between praja2 mRNA levels and patient survival (log-rank test, P ≤ 1e-4).

