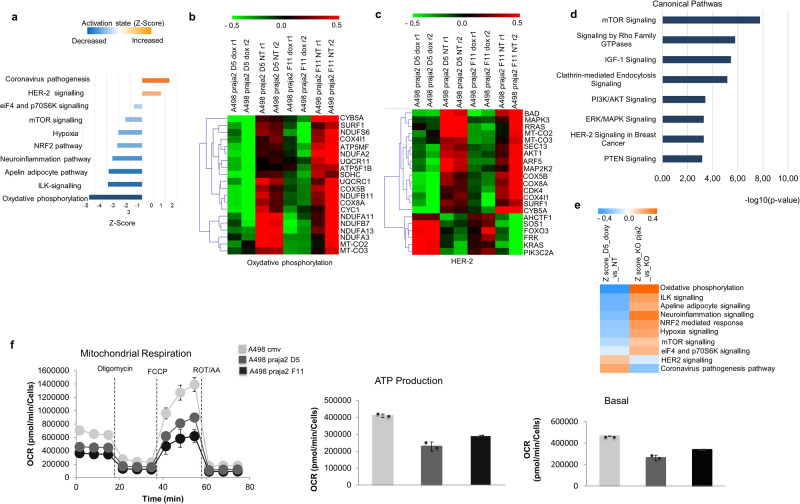
Fig. 7. Praja2 induces a transcriptional reprogramming in RCC cells.
a Histogram showing activation state (Z-score values) of the canonical pathway statistically significant (P = < 0.05) involving the differentially expressed RNA transcripts, as computed by the IPA tool. b, c Heatmaps summarizing the expression values of the differentially expressed transcripts involved in the molecular signature of the indicated pathways, as computed with IPA, in two different clones of A-498 cells stably expressing praja2 (D5 and F11). The analysis was conducted in cells treated with doxycycline versus untreated cells. Data are shown as normalized expression values in log2 scale and centered on the median value. d Functional enrichment analysis enriched by IPA of the differentially expressed RNA transcripts identified in the dataset KO praja2 vs WT. Only pathways with P ≤ 0.05 were considered for the further analysis. e Heatmap showing the activation state, measured as Z-score values, of the canonical pathways statistically significant (P ≤ 0.05), involving differentially expressed RNA transcripts in Doxy vs NT and KO praja2 vs WT sets, respectively. f Real-time oxygen consumption rate (OCR) of the two different clones of A-498 cells stably expressing FLAG-praja2 (D5 and F11) compared to cells expressing empty vector was measured at 37 °C using a Seahorse XF Analyzer (Seahorse Bioscience, North Billerica, MA, USA). Cells were plated into specific cell culture microplates (Agilent, USA) at the concentration of 3 × 10⁴ cells/well, and cultured for the last 12 h in DMEM, 10% FBS, in the presence of doxycycline. OCR was measured in XF media (non-buffered DMEM medium, containing 10 mM glucose, 2 mM L-glutamine, and 1 mM sodium pyruvate) under basal condition and after the sequential addition of 1.5 µM oligomycin, 2 µM FCCP, and rotenone + antimycin (0.5 µM all) (all from Agilent). Indices of mitochondrial respiratory function were calculated from OCR profile: basal OCR (before addition of oligomycin), maximal respiration (calculated as the difference of FCCP rate and antimycin + rotenone rate) and ATP production (calculated as the difference between basal OCR and oligomycin-induced OCR). Reported data are the mean values ± S.E.M. of four measurements deriving from two independent experiments.

