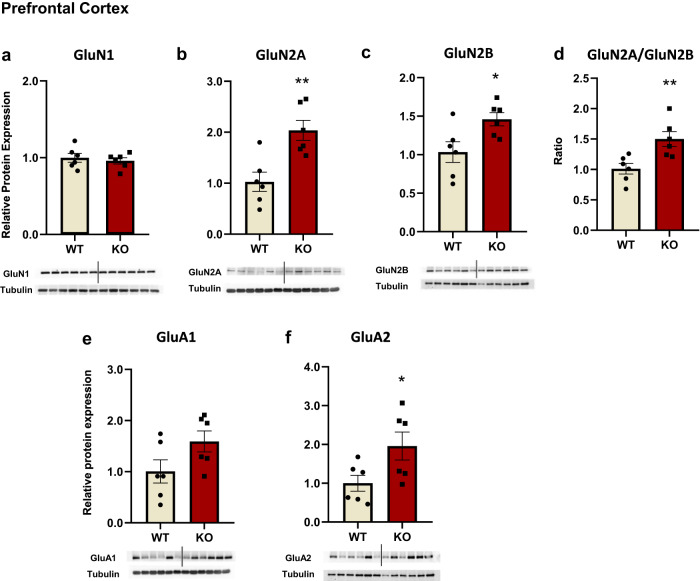
Fig. 2. NMDA and AMPA receptors subunits protein expression levels were found elevated in the prefrontal cortex of Fmr1 KO rats.
NMDA receptors subunits protein expression levels in the prefrontal cortex of the Fmr1 WT (n = 6) and KO (n = 6) rats. GluN1 (a), GluN2A (b), GluN2B (c), and ratio of GluN2A/GluN2B (d). AMPA receptors subunits protein expression levels in the prefrontal cortex of the Fmr1 WT (n = 6) and KO (n = 6) rats. GluA1 (e) and GluA2 (f). The optical density (OD) of each band was divided by the corresponding loading marker. Data are presented as relative protein expression to WT rats. Bellow each graph is presented a representative image from each western blot including a band of the protein of interest and the corresponding loading marker band. All results are represented as means ± SEM; *P < 0.05, **P < 0.01.

