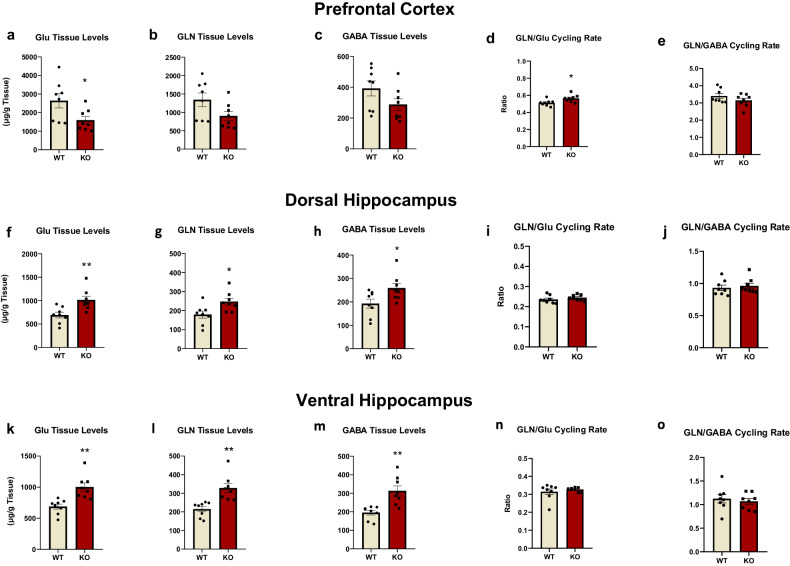
Fig. 4. Regionally dependent alterations in glutamatergic and GABAergic neurotransmission activity of Fmr1 KO rats.
Glutamate (Glu), Glutamine (GLN), GABA tissue levels and their cycling rates in the prefrontal cortex, the dorsal, and the ventral hippocampus of Fmr1 KO (n = 8) and WT (n = 8) rats. Glu (a), GLN (b), and GABA (c) along with cycling rate of GLN/Glu (d) and GLN/GABA (e) in the prefrontal cortex. Glu (f), GLN (g) and GABA (h) along with cycling rate of GLN/Glu (i) and GLN/GABA (j) in the dorsal hippocampus. Glu (k), GLN (l) and GABA (m) along with cycling rate of GLN/Glu (n) and GLN/GABA (o) in the ventral hippocampus. All results are represented as means ± SEM; *P < 0.05, **P < 0.01.

