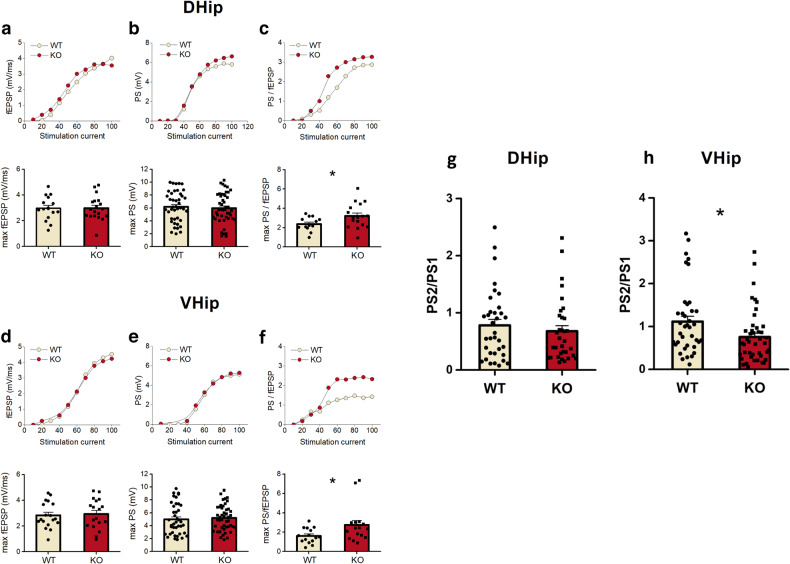
Fig. 5. Alterations in excitability and local inhibitory processes in the hippocampus of the Fmr1 KO rats.
Comparison of synaptic transmission, neuronal excitation, and neuronal excitability in WT and Fmr1 KO in the dorsal (D. Hip) (a–c) and ventral hippocampus (V. Hip) (d–f). Upper graphs in each panel show examples of input–output curves between stimulation current intensity and fEPSP or PS or PS/fEPSP. Synaptic transmission was compared between WT and KO rats by measuring the max fEPSP. Max fEPSP did not significantly differ between the WT and KO rats in either the dorsal (a) (WT n = 15 slices/12 rats and KO n = 19 slices/19 rats) or the ventral hippocampus (d) (WT n = 18 slices/16 rats and KO n = 18 slices/18 rats). Regarding neuronal excitation we found that max PS did not significantly differ between WT and KO rats in either the dorsal (b) (WT n = 42 slices/33 rats and KO n = 46 slices/35 rats) or the ventral hippocampus (e) (WT n = 40 slices/33 rats and KO n = 46 slices/37 rats). Neuronal excitability was compared between WT and KO rats by measuring the ratio PS/fEPSP at max PS value. Max PS/fEPSP significantly increased in KO compared with WT rats in both the dorsal (c) (WT n = 13 slices/11 rats and KO n = 17 slices/16 rats) and the ventral hippocampus (f) (WT n = 15 slices/13 rats and KO n = 16 slices/13 rats). Paired-pulse inhibition increases in the ventral, not dorsal, KO hippocampus. The effectiveness of paired-pulse inhibition was compared between WT and Fmr1 KO rats by measuring the ratio PS2/PS1 recorded at a stimulation strength that produced a half-maximum PS1. PS2/PS1 in the dorsal hippocampus (g) was comparable between WT and KO rats (WT n = 34 slices/29 rats and KO n = 33 slices/27 rats). However, PS2/PS1 was significantly smaller in KO compared with WT ventral hippocampus (h) (WT n = 38 slices/30 rats and KO n = 44 slices/32 rats), suggesting a higher inhibition in the KO vs WT ventral hippocampus. Collective data are shown in the bottom graphs in each panel and they are represented as means ± SEM; *P < 0.05.

