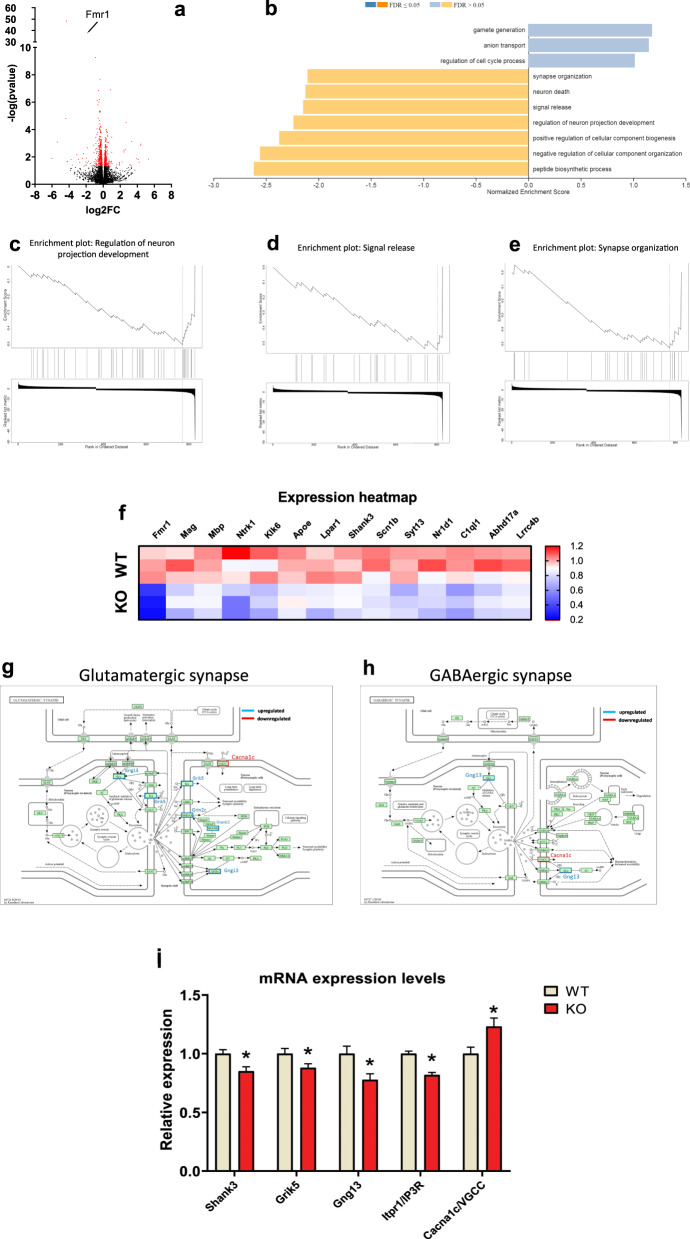
Fig. 6. Comprehensive analysis of gene expression and pathway enrichment in the hippocampus of the Fmr1 KO rats.
Volcano plot displaying the results of differential gene expression analysis. Differentially Expressed Genes (DEGs) are represented as red dots, while non-DEGs are depicted as black dots (a). Histogram presenting the enrichment analysis results from Gene Set Enrichment Analysis (GSEA) performed using the WebGestalt platform (b). The histogram illustrates the enrichment of upregulated and downregulated biological processes among the DEGs. c–e Enrichment plots demonstrating significant enrichment of DEGs in specific biological processes: “Regulation of neuron projection development” (c),“Signal release” (d), and “Synapse organization” (e). Expression heatmap showing gene expression levels of DEGs implicated in the biologic processes mentioned in (d–f). g, h Pathway depictions obtained from the KEGG database: Glutamatergic synapse pathway with upregulated genes outlined in red and labeled in red, and downregulated genes outlined in blue and labeled in blue (g); GABAergic synapse pathway with upregulated genes outlined in red and labeled in red, and downregulated genes outlined in blue and labeled in blue (h). Relative expression levels of the DEGs implicated in both the glutamatergic and GABAergic synapse pathways, allowing for comparative analysis of gene expression changes between the two pathways (i).

