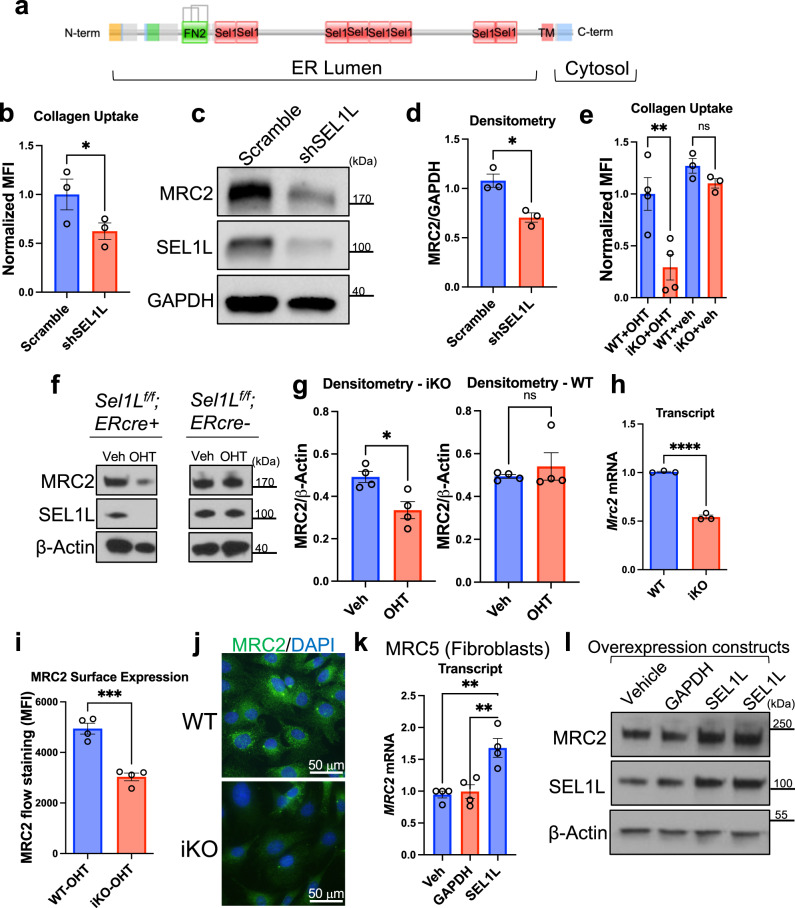
Fig. 5. SEL1L positively regulates collagen uptake and MRC2 expression.
a Schematic of domain structure of SEL1L protein. FN2 = Fibronectin-2. b Flow-cytometry based collagen-uptake assay in MRC5 lung fibroblasts after treatment with lentiviral-mediated shRNA against SEL1L or Scramble control. N = 3 per group, p = 0.0359. c, d Western blot and densitometry of MRC5 lung fibroblasts after shRNA treatment as indicated vs. Scramble control, representative of N = 3 independent experiments; p = 0.0102. e Flow-cytometry based collagen-uptake assay in MEF cells (mouse embryonic fibroblasts) after treatment with 4-hydroxytamoxifen (OHT) as indicated vs. vehicle control. WT = Sel1Lf/f;ERcre-, iKO = Sel1Lf/f;ERcre+. N = 4 (OHT condition), 3 (veh condition) per group; p = 0.0018 (left); p = 0.7830 (right). f, g Western blot and densitometry of MEFs after OHT treatment as indicated vs. control, representative of N = 4 independent experiments; p = 0.0168 (left), p = 0.6857 (right). h Q-RT-PCR in MEFs after OHT treatment for genes as indicated. N = 3 per group; p < 0.0001. i Flow-cytometry based measurement of MRC2 surface expression in MEFs after OHT treatment. N = 4 per group; p = 0.0004. j Representative wide-field immunofluorescence images of MEFs after OHT treatment. k Q-RT-PCR of MRC5 cells transfected with overexpression vectors containing genes as indicated vs. vehicle control (lipofectamine only). N = 4 per group; p = 0.0017 (vs. Veh), p = 0.0029 (vs. GAPDH). l Western blot of MRC5 cells transfected with overexpression vectors containing genes as indicated vs. vehicle control (lipofectamine only). N = 2. Data are shown as the mean ± SEM. Statistics: b paired Student’s t test (two-sided); (d, g - left panel, h, i) unpaired Student’s t test (two-sided); (e, k) one-way ANOVA with post-hoc Tukey testing; (g - right panel) unpaired Mann–Whitney U test (two-sided). *p < 0.05, **p < 0.01, ***p < 0.001, ****p < 0.0001, ns not significant. Source data are provided as a Source Data file.

