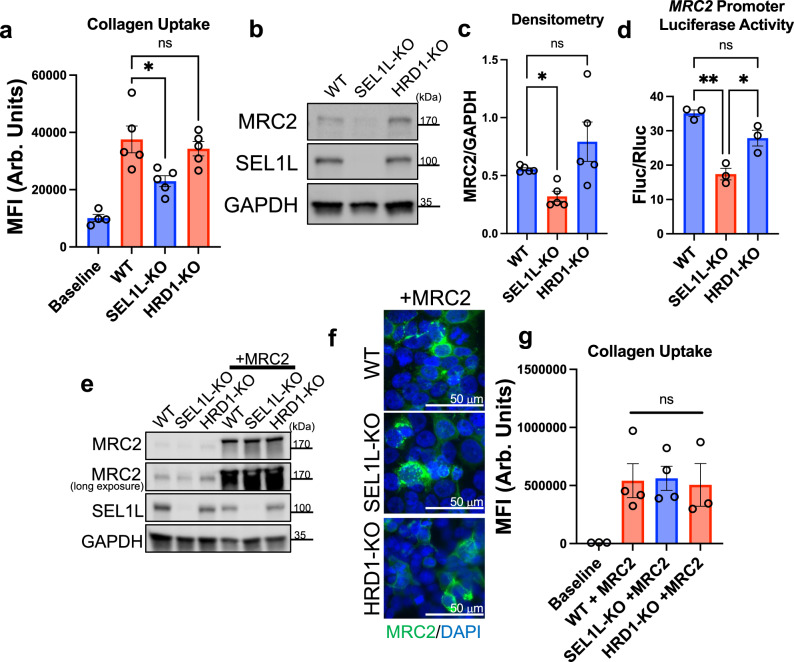
Fig. 6. SEL1L, but not HRD1, positively regulates MRC2.
a Flow-cytometry based collagen-uptake assay in HEK293T of different genotypes (compared with baseline control without fluorescent collagen). N = 4 (Baseline), 5 (WT, SEL1L-KO, HRD1-KO) per group; p = 0.0209 (vs. SEL1L-KO), p = 0.7682 (vs. HRD1-KO). b, c Western blot and densitometry of HEK293T cells of different genotypes, representative of N = 5 independent experiments; p = 0.0120 (WT vs. SEL1L-KO), p = 0.5143 (WT vs. HRD1-KO). d Firefly luciferase assay of MRC2 promoter activity, normalized to constitutive Renilla luciferase in HEK293T cells of different genotypes. N = 3 per group; p = 0.011 (WT vs. SEL1L-KO), p = 0.0162 (SEL1L-KO vs. HRD1-KO), p = 0.078 (WT vs. HRD1-KO). e Western blot of HEK293T cells of different genotypes transfected with MRC2 overexpression vector vs. vehicle control, representative of N = 6 independent experiments. f Representative wide-field immunofluorescence images of HEK293T cells of different genotypes transfected with MRC2 overexpression vector vs. vehicle control. g Flow-cytometry based collagen-uptake assay in HEK293T of different genotypes transfected with MRC2 overexpression vector (compared with baseline control without fluorescent collagen; note different scale compared with panel a). N = 3 (Baseline), 4 (WT, SEL1L-KO, HRD1-KO) per group; p = 0.9993 (WT vs. SEL1L-KO), p = 0.9898 (SEL1L vs. HRD1-KO). Data are shown as the mean ± SEM. Statistics: a, g one-way ANOVA with post-hoc Tukey testing; c repeated-measures ANOVA with post-hoc Bonferroni testing; d one-way ANOVA with post-hoc Bonferroni testing. *p < 0.05, **p < 0.01, ns not significant. Source data are provided as a Source Data file.

