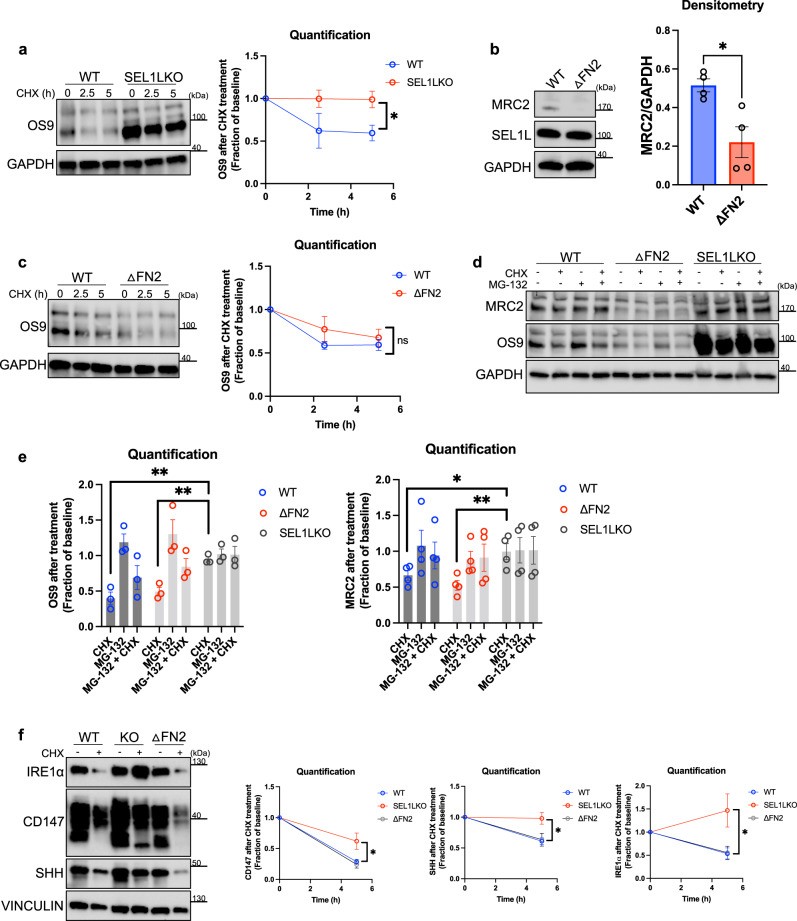
Fig. 8. The FN2 domain of SEL1L is likely dispensable for ERAD.
a Western blot and quantification (normalized to baseline for each condition) of WT vs. SEL1LKO cells for indicated proteins after treatment with cycloheximide for time specified, representative of N = 3 independent experiments; p = 0.0428 (at 5 h). b Western blot and densitometry of WT vs. ΔFN2 HEK293T cells created via CRISPR-mediated deletion of FN2 domain for indicated proteins, representative of N = 4 independent experiments; p = 0.0145. c Western blot and quantification (normalized to baseline for each condition) of WT vs. ΔFN2 cells as described in panel b for indicated proteins after treatment with cycloheximide for time specified, representative of N = 3 independent experiments; p = 0.400 (at 5 h). d, e Western blot and quantification (expressed as fraction of vehicle only treated baseline for each condition) of WT vs. ΔFN2 vs. SEL1LKO cells for indicated proteins after treatment with cycloheximide and/or proteasome inhibitor MG-132, representative of N = 3 (left), 4 (right) independent experiments; p = 0.0022 (left, KO vs. WT), p = 0.0058 (left, KO vs. ΔFN2), p = 0.0467 (right, KO vs. WT), p = 0.0075 (KO vs. ΔFN2). f Western blot and quantification (expressed as fraction of vehicle only treated baseline for each condition) of WT vs. SEL1LKO vs. ΔFN2 cells for indicated proteins after treatment with cycloheximide, representative of N = 4 independent experiments; quantification of CD147 refers to the lower band (core-glycosylated CD147); all p-values at 5 h: p = 0.0468 (CD147, KO vs. WT), p = 0.0258 (CD147, KO vs. ΔFN2), p = 0.0309 (SHH, KO vs. WT), p = 0.0431 (SHH, KO vs. ΔFN2), p = 0.0393 (IRE1α, KO vs. WT), p = 0.0440 (IRE1α, KO vs. ΔFN2). Data are shown as the mean ± SEM. Statistics: a, b unpaired Student’s t test (two-sided); c unpaired Mann–Whitney U test (two-sided). *p < 0.05. e, f one-way ANOVA with post-hoc Bonferroni testing. *p < 0.05, **p < 0.01, ns not significant. Source data are provided as a Source Data file.

