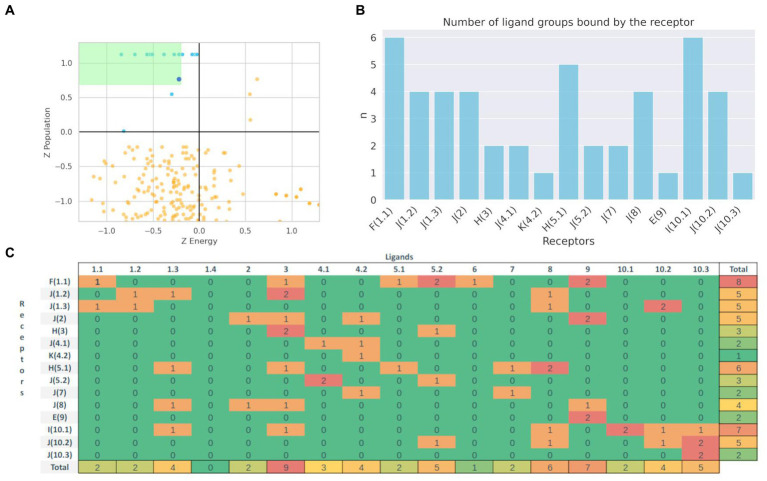
Figure 7.
Population vs. Binding Energy plot (Z-score) for the docking of true (Blue) and other (Orange) ligands. Green zone represents the zone that defines potential binders (A). Distribution of the number of predicted 17 different group ligands that bind to each Phylogenetic defined type of BacCYP (B). Binding results matrix. Rows represent Representative Ligand Group-Bound Proteins, with the actual known ligand group that binds the corresponding protein between parenthesis, columns represent each ligand type group. Numbers represent the count of ligands from the respective groups that are predicted to bind the corresponding BacCYP according to the docking results (C).

