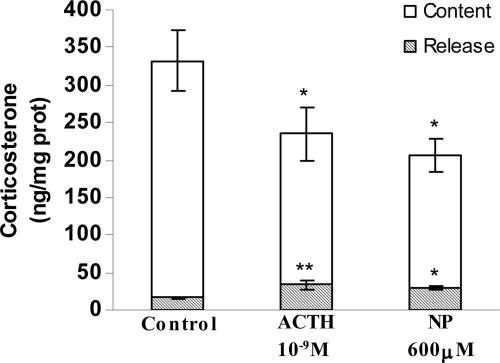
Fig. 8.
Effect of ACTH and NP on corticosterone content (white columns) and release (gray columns) in AGs incubated for 30 min in vitro. Values represent means ± SEM for seven to eight AGs per group. Data were evaluated by ANOVA, followed by a Newman-Keuls posttest. **, P < 0.01; *, P < 0.05 vs. respective control group.

