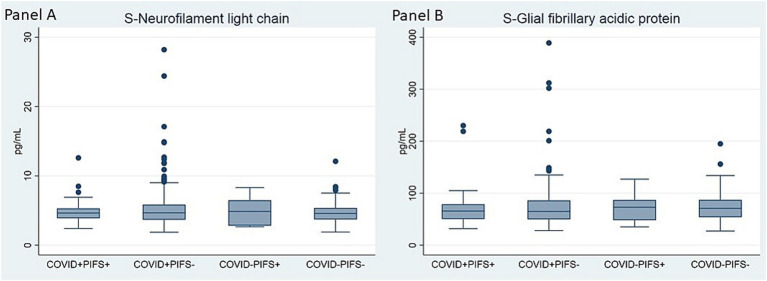
Figure 2.
Comparison of serum levels of neurofilament light chain (A) and glial fibrillary acidic protein (B) at 6-months follow-up within groups of COVID-19 status and PIFS adherence. Kruskal-Wallis test was conducted to examine the differences between groups Panel (A): Chi square = 0.89, p = 0.827, df = 3; Panel (B): Chi square = 0.87, p = 0.834, df = 3.

