Fig. 4.
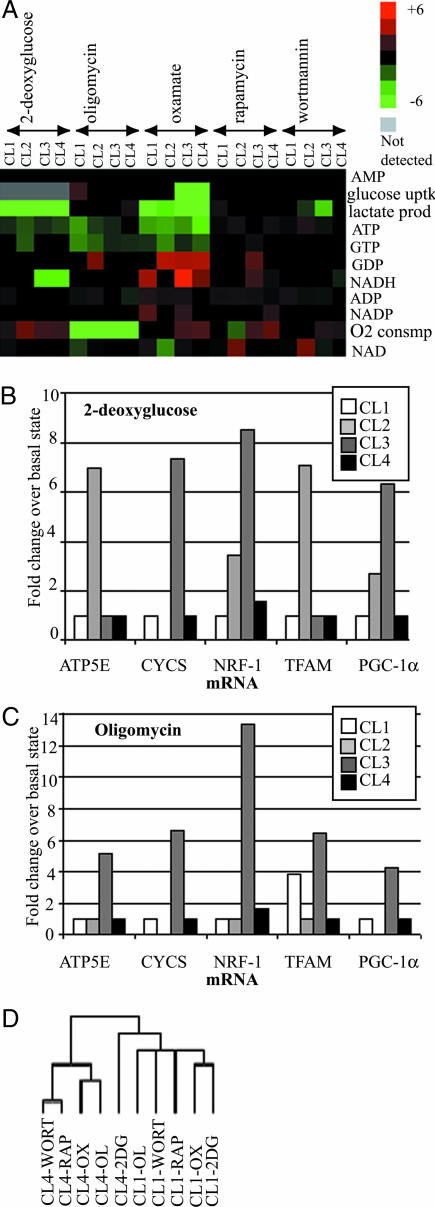
Perturbational profiling of cell-line models of tumorigenesis. The four cell lines were perturbed by using 2-deoxyglucose, oligomycin, oxamate, rapamycin, and wortmannin as described in Materials and Methods. (A) The fold change of the normalized levels of metabolic measurement (with respect to that of the unperturbed basal states of the respective cell lines) was used to construct heat maps. The columns in the heat map are grouped by the small-molecule perturbagen. (B) The relative levels of TFAM, CYCS, ATP5E, PGC-1α, and NRF-1 transcripts, prepared from the four cell lines after treatment with 2-deoxyglucose, were expressed as fold change over their respective levels in the unperturbed basal state and plotted on the bar graph. (C) Same analysis as in B, after the four cell lines were treated with oligomycin. (D) Hierarchical clustering of cell states and metabolites, with additional metabolite measurements from GC-MS. The columns representing the cell states are labeled by the name of the cell line followed by the perturbation. 2DG, 2-deoxyglucose; OL, oligomycin; OX, oxamate; RAP, rapamycin; WORT, wortmannin.

