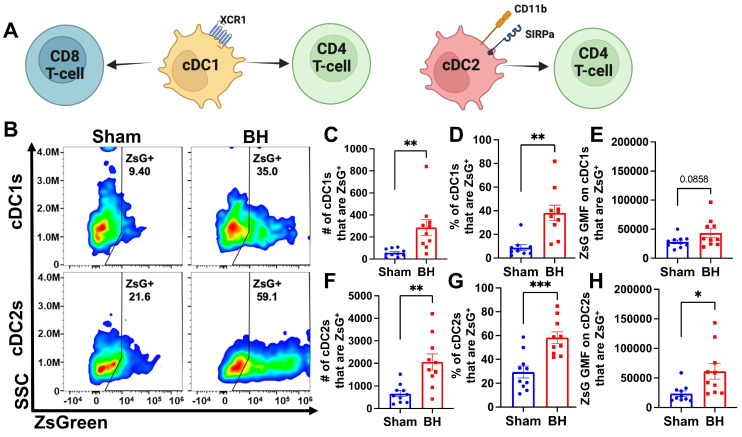
Figure 4.
BH increases ZsG tumor antigen presence in cDCs in the tumor draining lymph nodes. A. Overview of CD8+ and CD4+ T cell activation by cDC1s and cDC2s. B. Density scatter plots of side scatter vs ZsG for cDC1s (top) and cDC2s (bottom). C & F. Bar graphs of numbers of cDCs that are ZsG+. D & G. Bar graphs of percentages of cDCs that are ZsG+. E & H. Bar graphs of ZsG GMF on cDCs that are ZsG+. n=10 per group. Unpaired Welch's t-test: ∗ p < 0.05, ∗∗ p < 0.01, ∗∗∗ p < 0.001. Means ± SEM.

