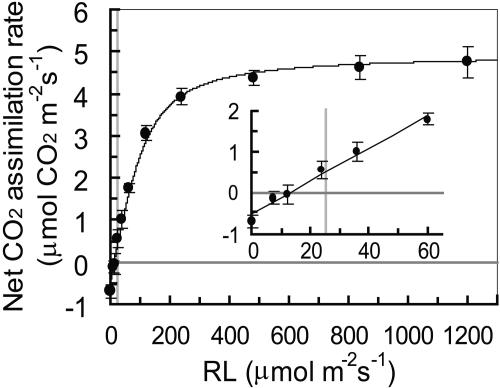
Figure 1.
Light-Response Curve of Net CO2 Assimilation Rate in Leaves of the Wild Type.
Red light (RL) intensity (equivalent to PAR) varied from 7.2 to 1200 μmol m−2 s−1. Each point represents the mean of three measurements ± se. Vertical gray line indicates the light intensity used in growth tests (25 μmol m−2 s−1).

