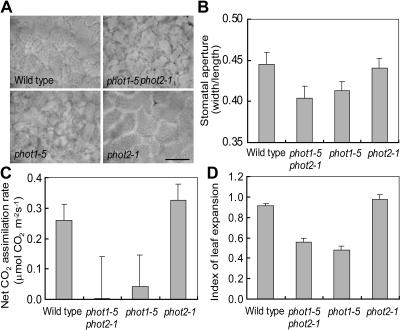
Figure 6.
Phototropin-Mediated Physiological Responses under Red Light (25 μmol m−2 s−1) with Blue Light (0.1 μmol m−2 s−1).
(A) Distribution of chloroplasts in mesophyll cells of wild-type and mutants leaves. Micrographs were taken from the adaxial side of leaves. Bar = 50 μm.
(B) Stomatal aperture in leaves of the wild type and mutants. Apertures are expressed as the ratio of width to length of the guard cell pair, as described in Methods. Bars represent means ± se (n = 30).
(C) Net CO2 assimilation rate in leaves of the wild type and mutants. Bars represent means ± se (n = 10).
(D) Leaf expansion of the wild type and mutants. The degree of expansion is expressed as the ratio of the projection of the leaf before and after artificial uncurling. Bars represent means ± se (n = 5).

