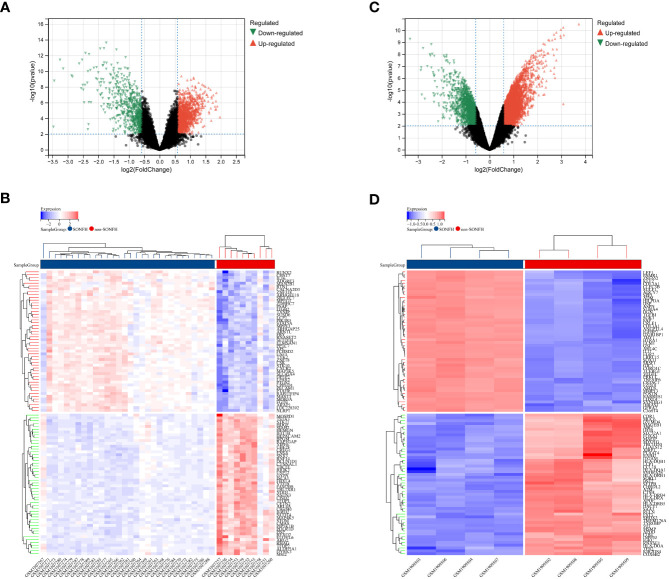
Figure 2.
Differentially expressed genes (DEGs) related to GC-related femoral head avascular necrosis. (A) Volcano plot of DEGs in GSE123568 associated with femoral head necrosis. The x-axis represents log2FoldChange, and the y-axis represents -log10(adjusted P-value). Red nodes indicate upregulated DEGs, green nodes indicate downregulated DEGs, and black nodes represent genes with no significant differential expression. (B) Heatmap of expression levels of DEGs in GSE123568 associated with femoral head necrosis: blue represents disease samples, red represents normal control samples, red represents genes with high expression, and blue represents genes with low expression. (C) Volcano plot of DEGs in GSE74089 associated with femoral head necrosis. The x-axis represents log2FoldChange, and the y-axis represents -log10(adjusted P-value). Red nodes indicate upregulated DEGs, green nodes indicate downregulated DEGs, and black nodes represent genes with no significant differential expression. (D) Heatmap of expression levels of DEGs in GSE74089 associated with femoral head necrosis: blue represents disease samples, red represents normal control samples, red represents genes with high expression, and blue represents genes with low expression.

