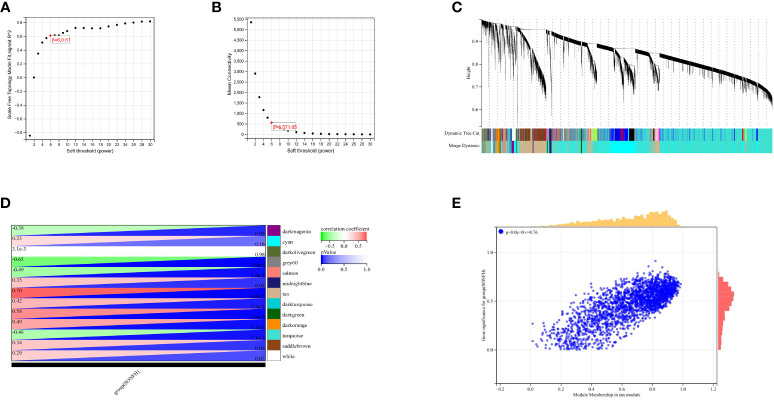
Figure 3.
Results of WGCNA. (A) Fit indices of scale-free topology model under different soft thresholding powers. (B) Average connectivity values under different soft thresholding powers. (C) Gene dendrogram. (D) Correlation between different modules and clinical features. Red indicates positive correlation, and blue indicates negative correlation. (E) Correlation between module membership and gene importance in the tan module.

