Figure 5.
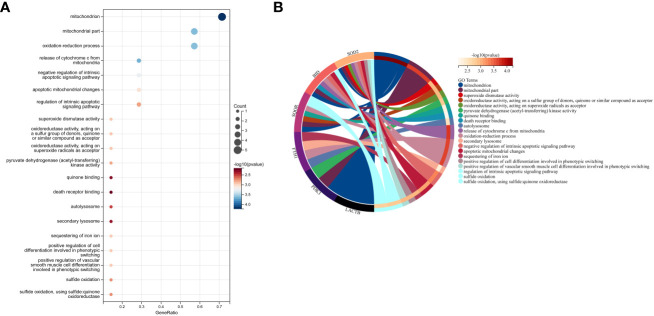
Performing GO functional enrichment analysis for 7 key mitochondrial-related genes in SONFH. (A) Bubble plot showing the top 15 enriched functions for the 7 target genes. (B) Chord plot representing the relationship between the top 15 enriched functions and the targets, with node colors arranged in descending order of logFC values from red to blue. Genes are sorted based on logFC values.

