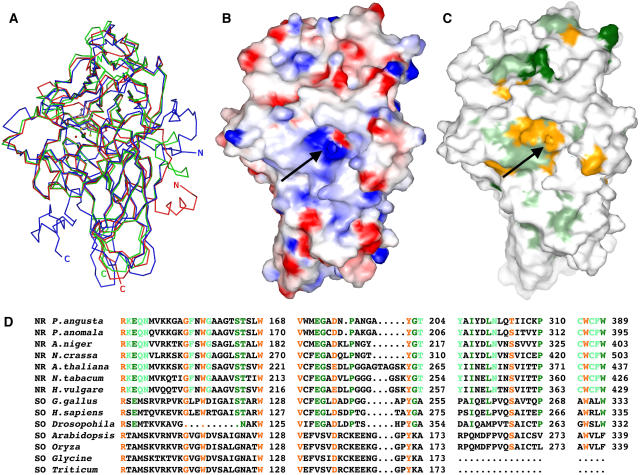
Figure 4.
Comparisons between NR-Mo and SOs.
(A) Superposition of NR-Mo fragments from P. angusta NR (blue), PSO (green), and CSO (red). The figure was generated as described in Figure 2.
(B) Electrostatic surface potential of NR-Mo. Surface residues are color coded according to their charge (blue for positively charged and red for negatively charged side chains). Hydrophobic areas are not colored. The view is toward the entrance of the substrate funnel (arrow). The electrostatic potential map was calculated at an ionic strength of 100 mM and contoured at ±10 kBT (kB, Boltzmann constant; T, absolute temperature).
(C) and (D) Conserved residues among enzymes of the SO family are shown on the surface (C) and in an alignment (D). Residues that are identical (one outlier was excepted) among all NRs are shown in light green, those among NRs and animal SOs are shown in dark green, and those among the entire SO family of Mo enzymes (including both NRs and SOs) are shown in orange. Sequence alignments were generated with ClustalW, and the last residue of each sequence line is numbered. Surfaces were generated using GRASP (Nicholls et al., 1991) and rendered with POVRAY.

