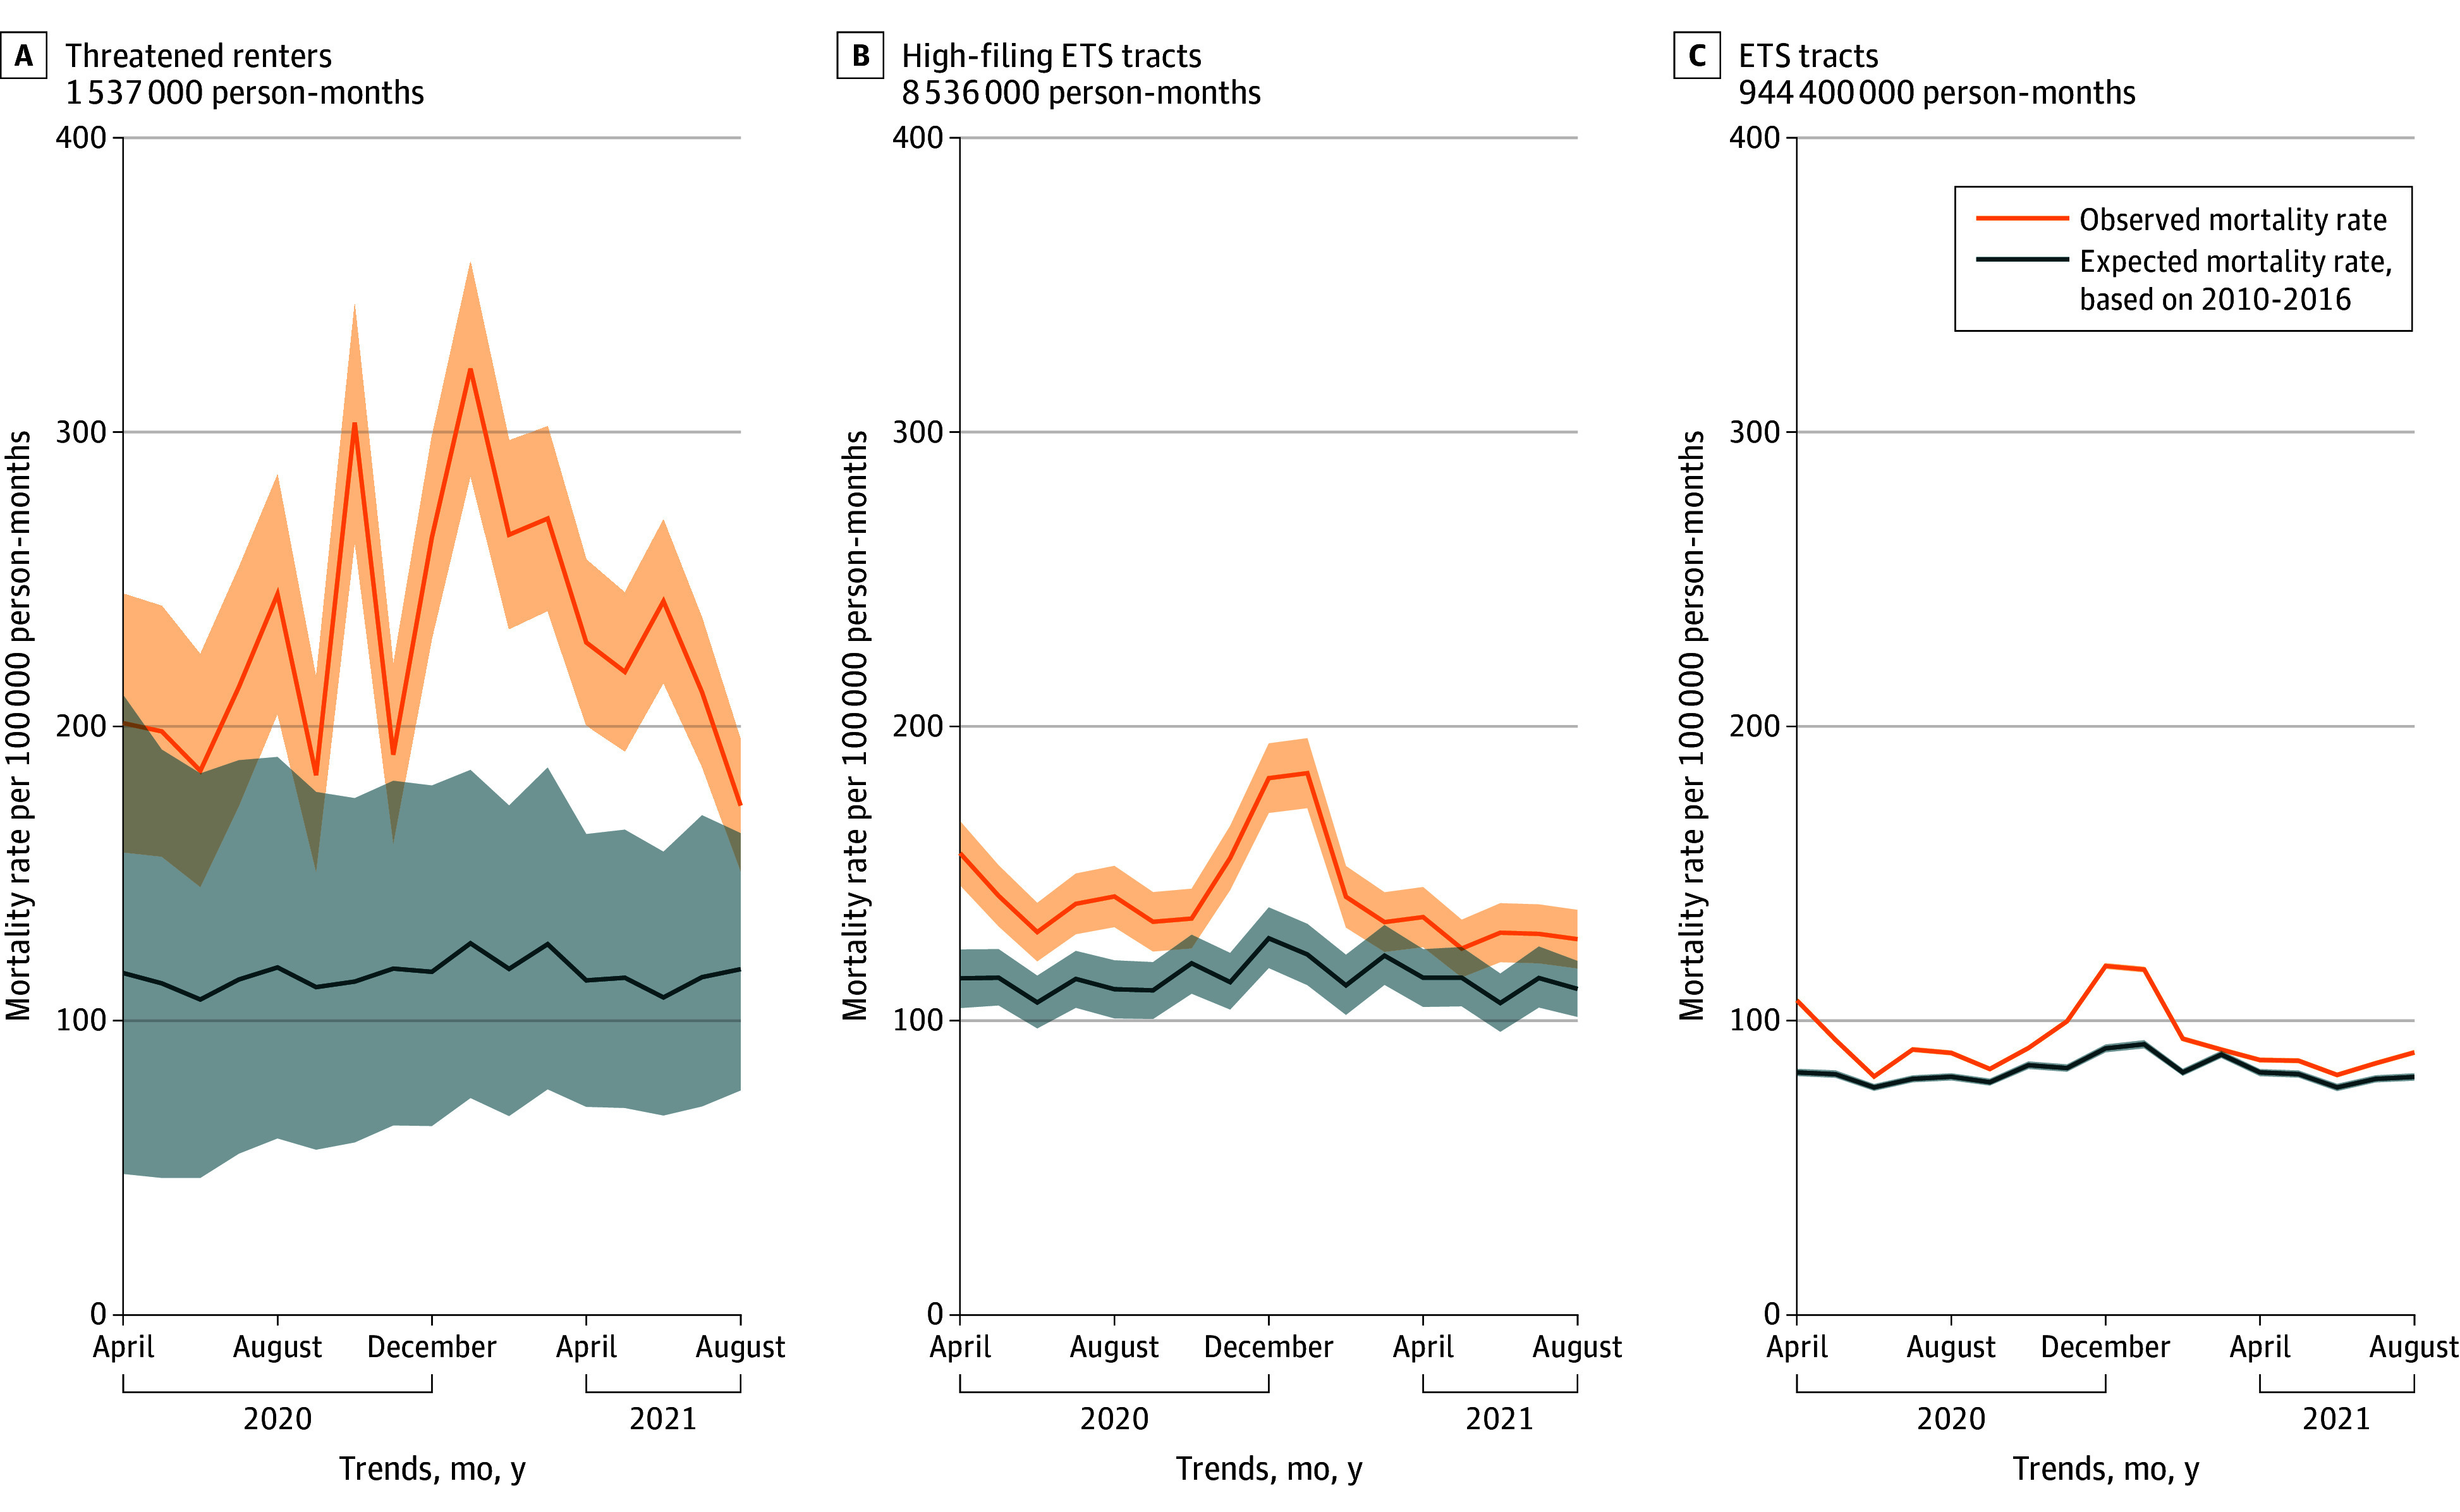
Figure 2. Monthly Trends in Observed Age-Standardized All-Cause Mortality (April 1, 2020, to August 31, 2021) Compared With Expected Mortality.

Expected mortality is based on a model adjusting for age, calendar month, and year. Threatened renters refers to renters who were directly linked to an eviction filing. High-filing ETS tracts are those with high filing and poverty rates. The 95% uncertainty intervals (indicated by shading) are reported from the model of expected mortality based on historical trends (note these are very narrow for the general population in eviction tracking system [ETS] tracts). Data were approved by the Census Disclosure Review Board (CBDRB-FY23-CES004-013; CBDRB-FY22-CES004-057) and sourced from the 2021 Numident file linked to eviction records26 and the 2015/2019 Residence Candidate File.27
