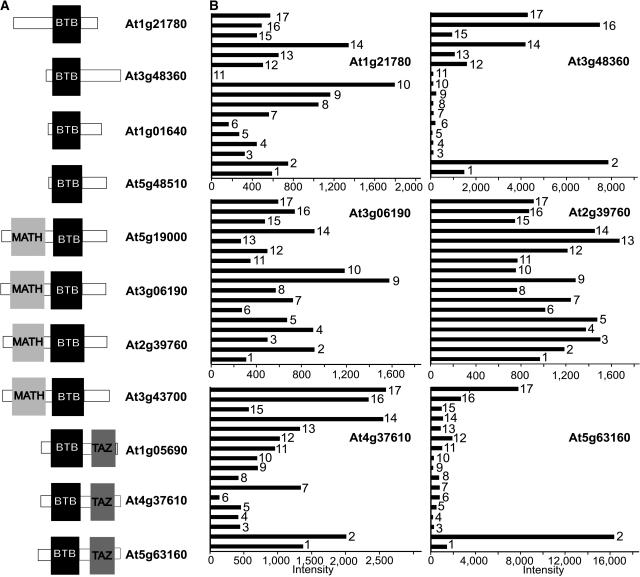
Figure 9.
Representative BTB Protein Domain Structures and Organ-Specific Expression Profiles.
(A) Schematic comparison of the domain structures of selected Arabidopsis BTB proteins. The protein sequences of several Arabidopsis BTB proteins were analyzed using the PFAM domain database. The black boxes denote the BTB domains, the light gray boxes denote the MATH domains, and the dark gray boxes denote the TAZ domains.
(B) Expression profile of six selected BTB genes in different Arabidopsis tissues/organs derived from a genome-profiling study using a 70-mer oligonucleotide microarray (Ma et al., 2005). For each tissue/organ under consideration, the relative expression levels of the BTB genes are shown, with the normalized intensities represented by black bars. Bar 1, cauline leaf; bar 2, rosette leaf; bar 3, pistil, 1 d after pollination; bar 4, pistil, 1 d before pollination; bar 5, silique, 3 d after pollination; bar 6, silique, 8 d after pollination; bar 7, stem; bar 8, sepal; bar 9, stamen; bar 10, petal; bar 11, germinated seed; bar 12, root in dark; bar 13, root in white light; bar 14, hypocotyl in dark; bar 15, hypocotyl in white light; bar 16, cotyledon in dark; bar 17, cotyledon in white light.

