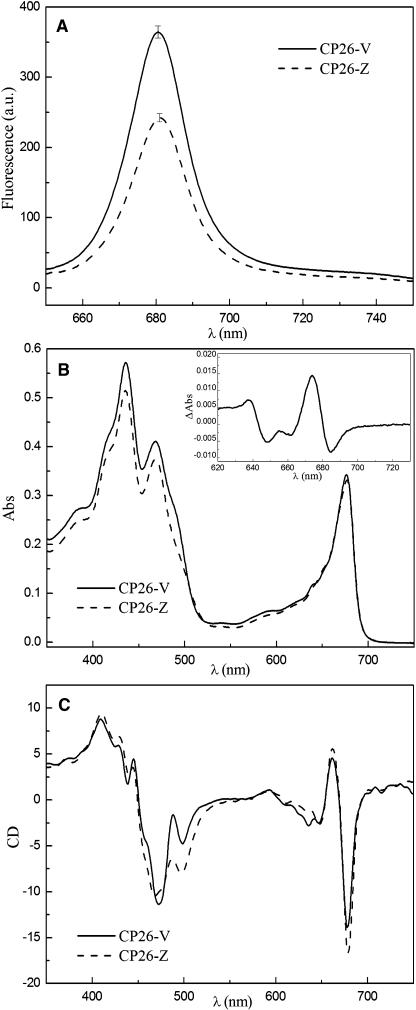
Figure 6.
Spectral Properties at Room Temperature of Lhcb5 Isoforms Purified by IEF (See Figure 5B).
(A) Comparison of fluorescence yield of CP26-V (solid line) and CP26-Z (dotted line) upon excitation at 625 nm. Data are the average of four independent measurements. a.u., arbitrary units.
(B) Absorption spectra of CP26-V (solid line) and CP26-Z (dotted line) normalized to the chlorophyll content. Inset, difference spectrum in the Qy transition region.
(C) Circular dichroism spectra of CP26-V (solid line) and CP26-Z (dotted line). All the spectra were normalized to the same chlorophyll content.

