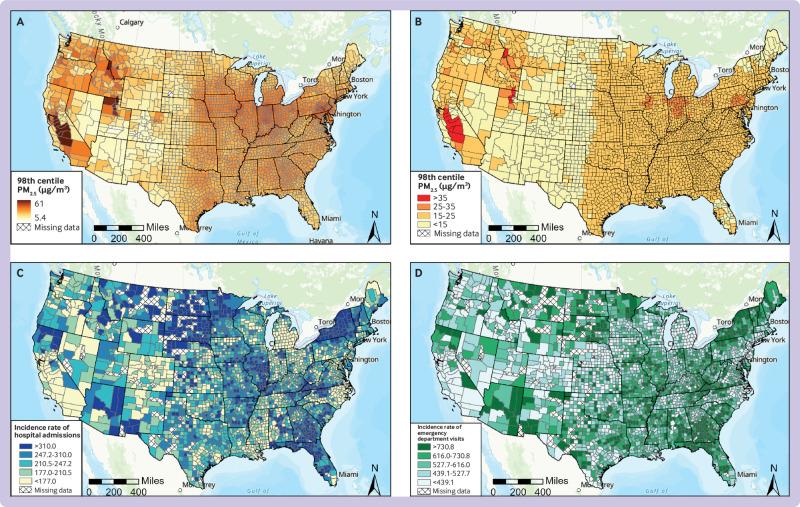
Fig 3.
Maps of the 98th centile distribution of PM2.5 (fine particulate matter) concentrations and incidence rates per million enrollees per day of hospital admissions and emergency department visits for natural causes across US counties, 2010-16: (A) 98th centile distributions of PM2.5 concentrations; (B) 98th centile distributions of PM2.5 concentrations categorized by World Health Organization and national ambient air quality standards; (C) incidence rate per million enrollees per day of hospital admissions for natural causes in US counties; (D) incidence rate per million enrollees per day of emergency department visits for any cause in US counties. Crosshatching represents counties with missing air pollution data—the total number of hospital admissions or emergency department visits in these counties fell below the small cell suppression limit of 11

