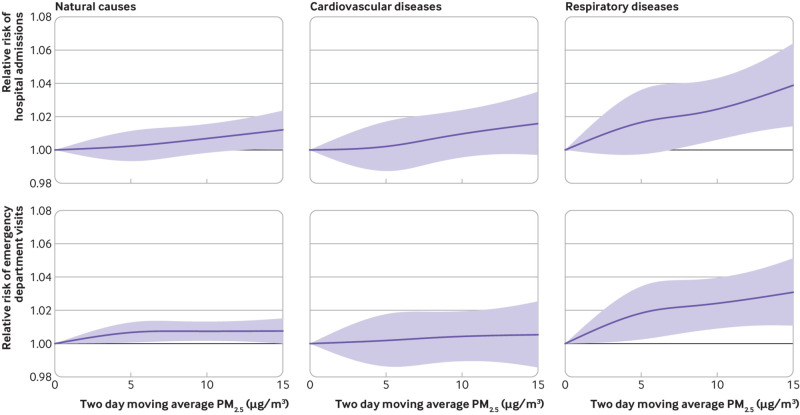
Fig 5.
Exposure-response curve for association between two day moving average of PM2.5 (fine particulate matter) concentrations and hospital admissions and emergency department visits for natural causes, cardiovascular disease, and respiratory disease. The reference point on the curve is the counterfactual concentration at 0 μg/m3 of the two day moving average PM2.5 during the study period

