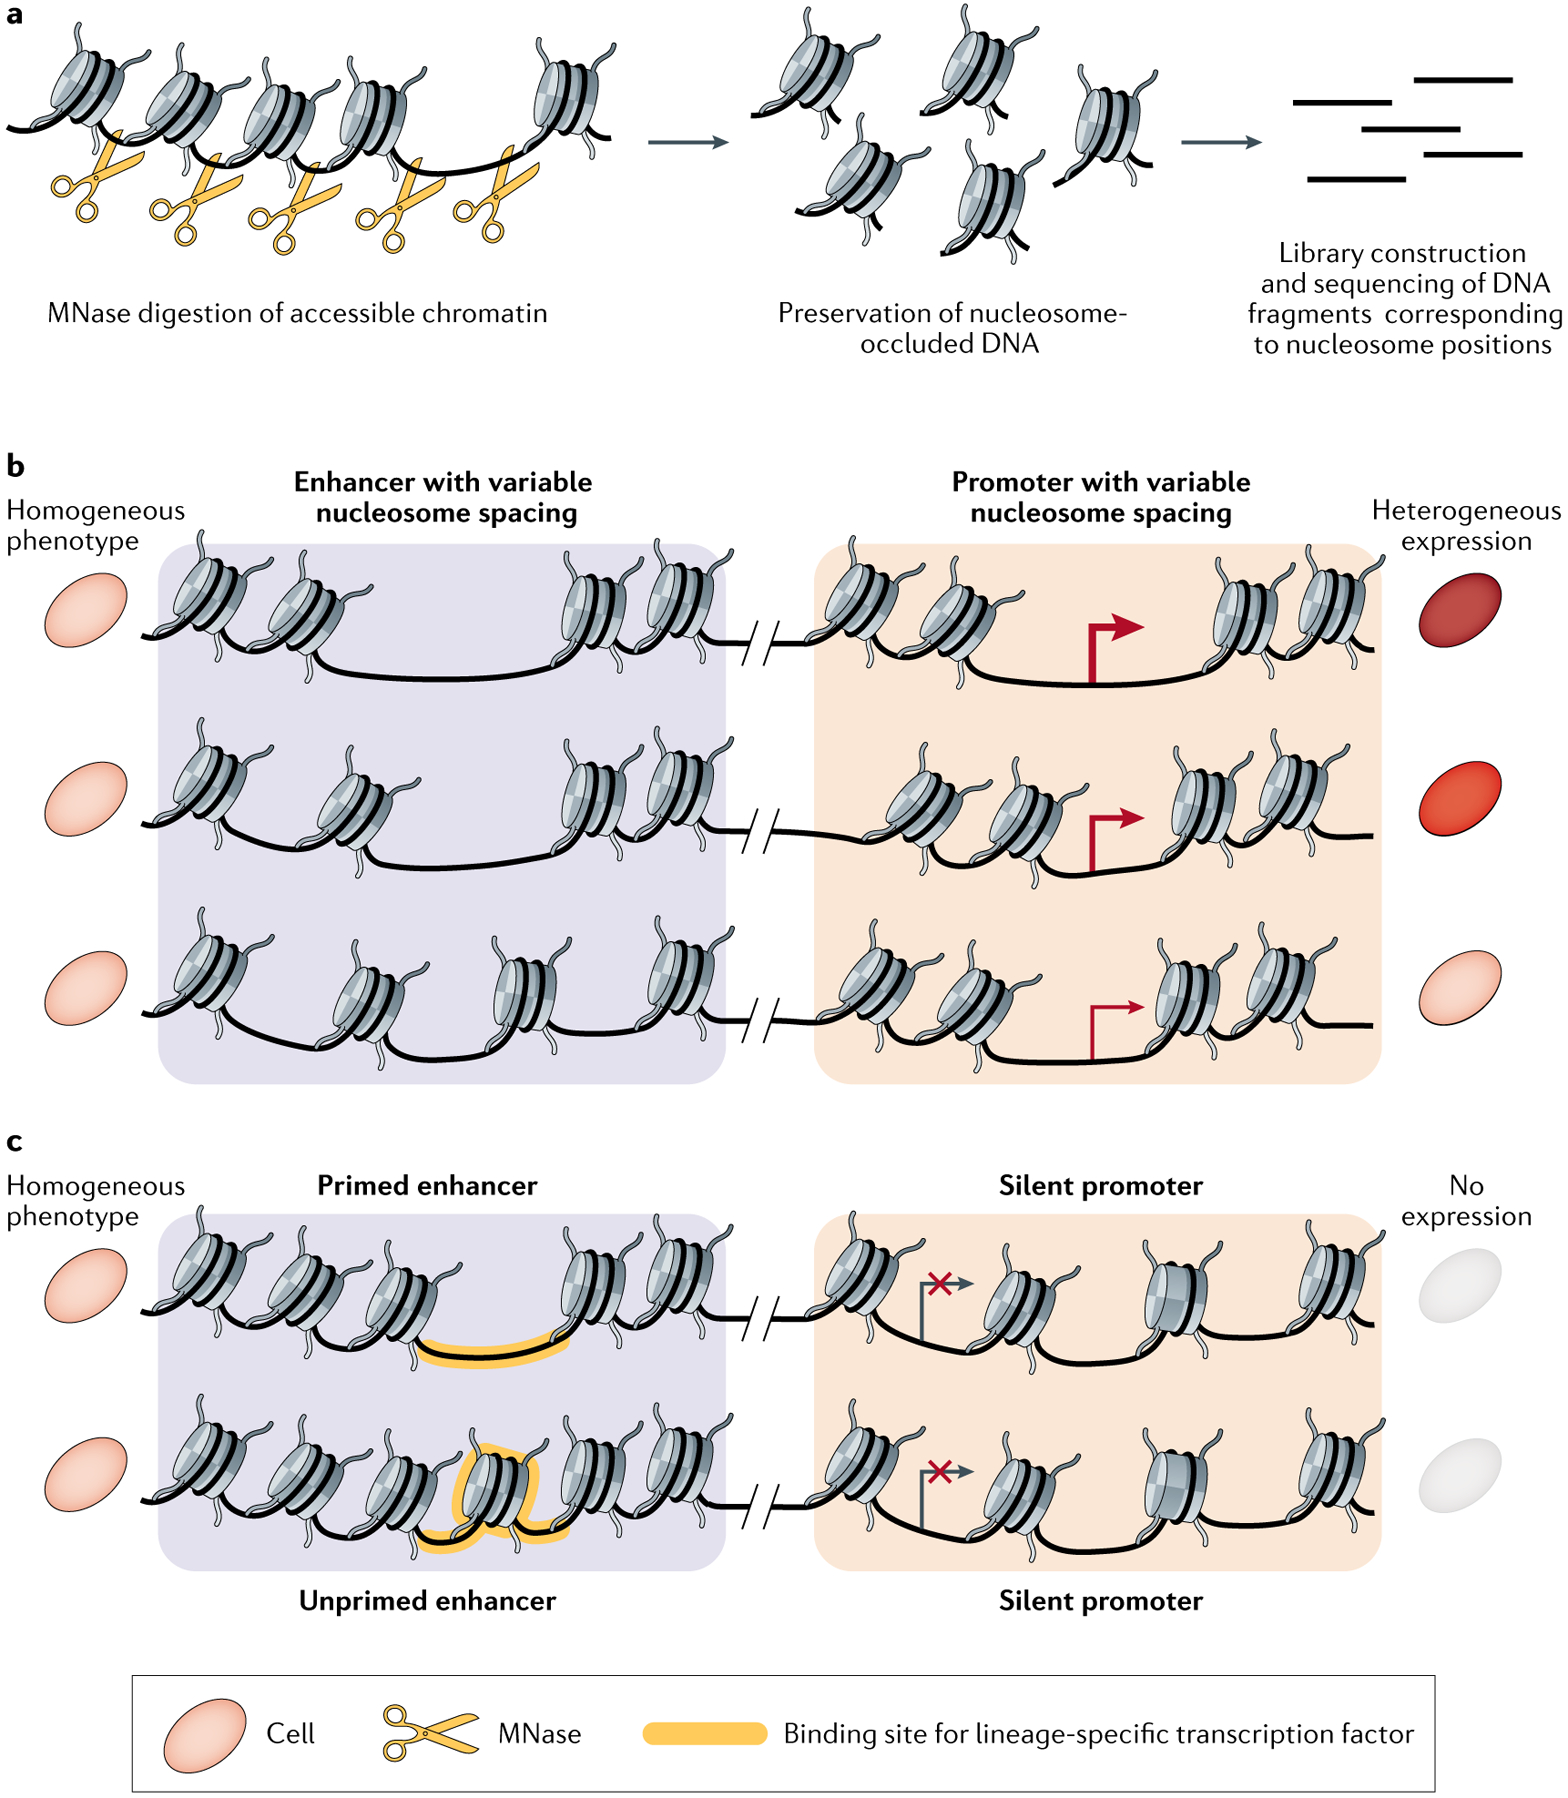
Fig. 4 |. scMNase-seq reveals nucleosome positioning dynamics.

a | Diagram depicting how nucleosome-bound DNA sequences are isolated for sequencing using micrococcal nuclease digestion deep sequencing (MNase-seq). Open chromatin and linker DNA is digested using micrococcal nuclease (MNase), and the resulting nucleosome-occluded DNA fragments are isolated and sequenced. b | Illustration of variable nucleosome positioning around accessible chromatin sites among a morphologically homogeneous cell population. The spacing mode of nucleosomes flanking the enhancer informs expression levels of the associated gene. Arrow thickness represents elevated levels of transcription. c | Illustration of enhancer priming in a morphologically homogeneous population. The yellow-shaded region represents nucleosome depletion at a lineage-specific transcription factor binding motif. Such epigenetic priming, which can produce cells with different developmental potentials, is not detectable using single-cell RNA sequencing because the gene is not expressed in either cell. scMNase-seq, single-cell MNase-seq.
