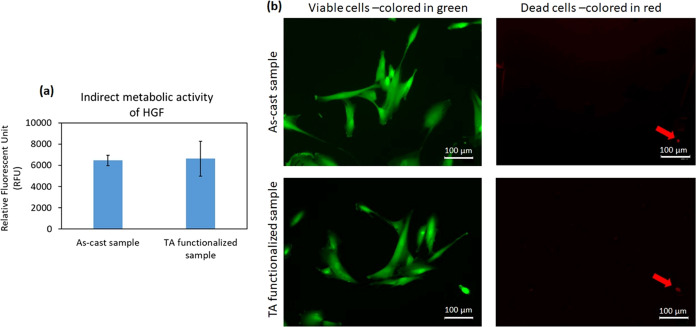
Figure 7.
Indirect cytocompatibility evaluation of Ti60Zr20Si8Ge7B3Sn2 MG ribbon surfaces on HGF cells after 24 h. (a) Metabolic activity of cells and (b) live/dead fluorescent stain; the left panel demonstrates the viable cells that were colored in green, and the right panel shows the dead cells with red color. Arrows indicate the dead cells; scale bar = 100 μm.

