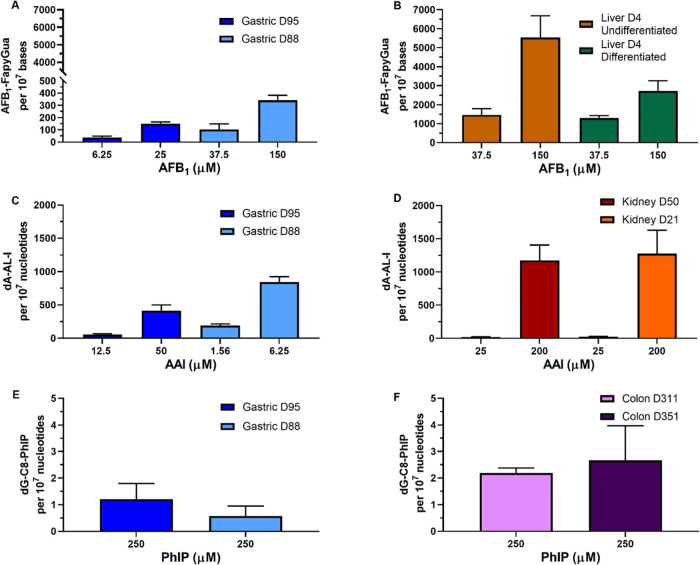
Figure 4.
DNA adduct levels in human tissue organoids after treatment with AFB1, AAI, and PhIP. Gastric (D95 and D88; A, C, and E), liver undifferentiated and differentiated (D4; B), kidney (D50 and D21; D), and colon (D311 and D351; F) organoids were treated with the indicated concentrations of AFB1, AAI, and PhIP for 48 h. Vehicle controls (DMSO or water) were included (not shown). AFB1–FapyGua adduct was quantified using LC-MS/MS (A, B). dA-AL-I (C, D) and dG-C8-PhIP (E, F) adduct formation was quantified by using UPLC-ESI/MS3. Results are shown as mean ± SD (n ≥ 3).

