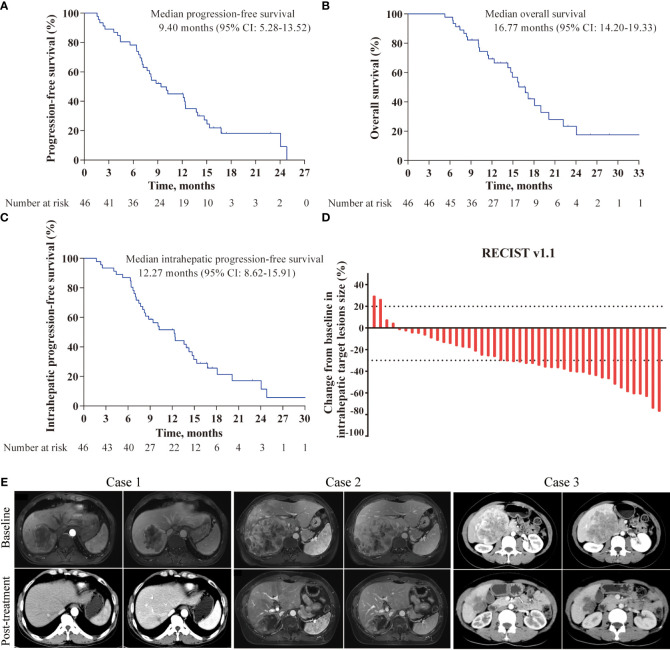
Figure 2.
Kaplan-Meier curves and characteristics of tumor response in the study. (A) Kaplan-Meier survival curves of progression-free survival; (B) Kaplan-Meier survival curves of overall survival; (C) Kaplan-Meier survival curves of intrahepatic progression-free survival; (D) Best percentage changes from baseline in size of the intrahepatic target lesions; (E) Representative images of three patients responded to the triple combination therapy.

