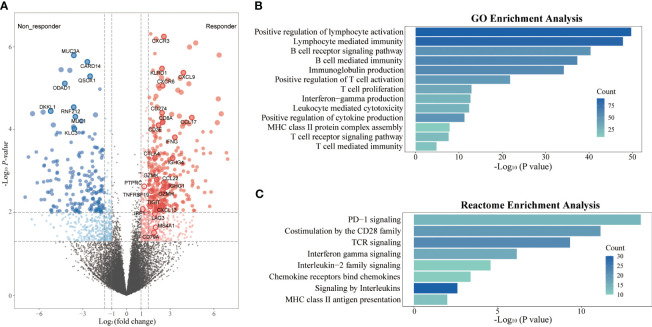
Figure 4.
Transcriptome analyses in responders and non-responders. (A) Differential expression genes between responders (n=9) and non-responders (n=9) in the RNAseq cohort; (B) GO enrichment analysis of differential expression genes; (C) REACTOME pathway enrichment analysis of differential expression genes.

