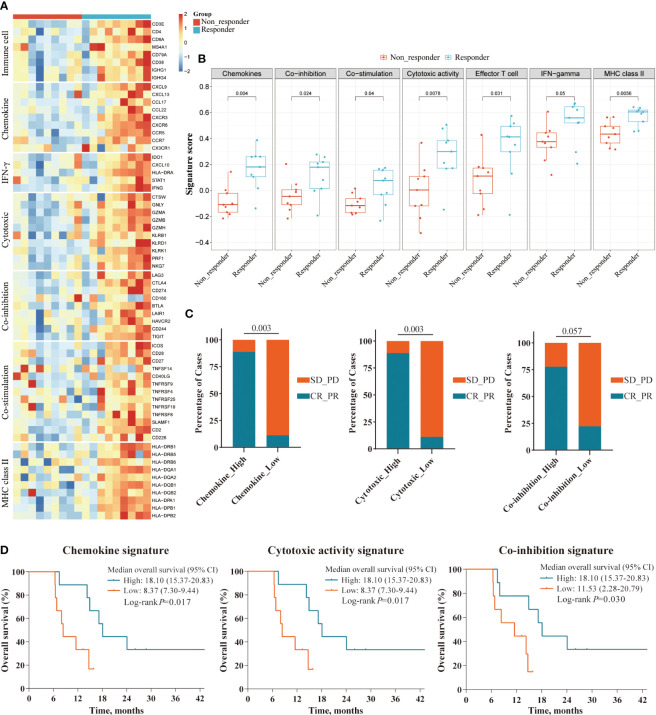
Figure 5.
Survival analyses of immune-related gene signatures in responders and non-responders. (A) Heatmap showing the expression level of gene signatures representing pre-existing antitumor immunity between responders and non-responders in the RNAseq cohort; (B) Boxplot showing the expression scores of gene signatures between responders and non-responders in the RNAseq cohort; (C, D) Superior ORR and OS were associated with higher expression level of three gene signatures: Chemokine, Cytotoxic activity, and Co-inhibition signature, defined by the median split.

