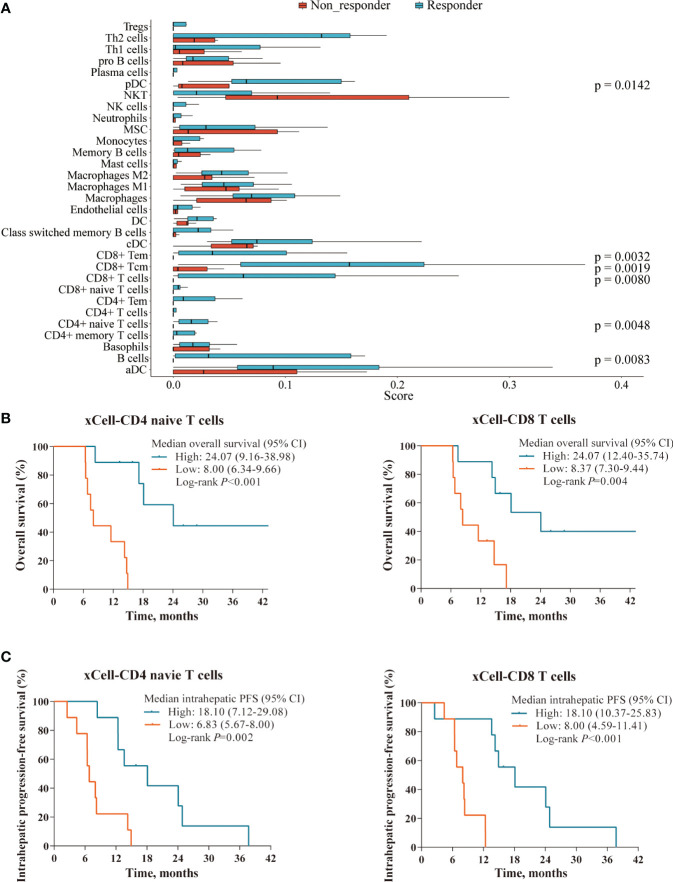
Figure 6.
Immune cell profile analyses in the RNAseq cohort. (A) Boxplot showing the abundance of several immune cells composition between responders (n=9) and non-responders (n=9) in the RNAseq cohort, deconvolved by xCell algorithm. (B, C) Superior OS and intrahepatic PFS were associated with higher levels of tumor-infiltrating lymphocytes defined xCell deconvolution analysis: CD4 naïve T cells (left panel) and CD8 T cells (right panel).

