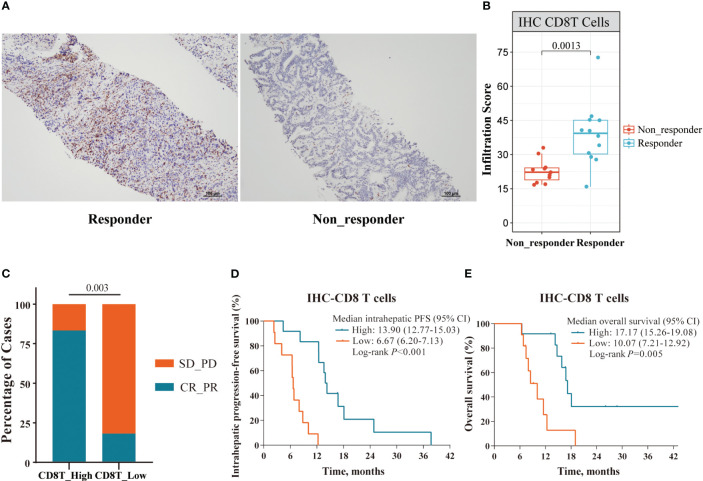
Figure 7.
Immune cell profile analyses in the IHC cohort. (A) Representative IHC staining images of responder and non-responder; (B) The Boxplot showing the significant differences with a density of tumor-infiltrating CD8+ T cells between responders (n=12) and non-responders (n=11) in the IHC cohort; (C–E) Superior ORR, intrahepatic PFS and OS were associated with higher density of tumor-infiltrating CD8+ T cells, defined by median split.

