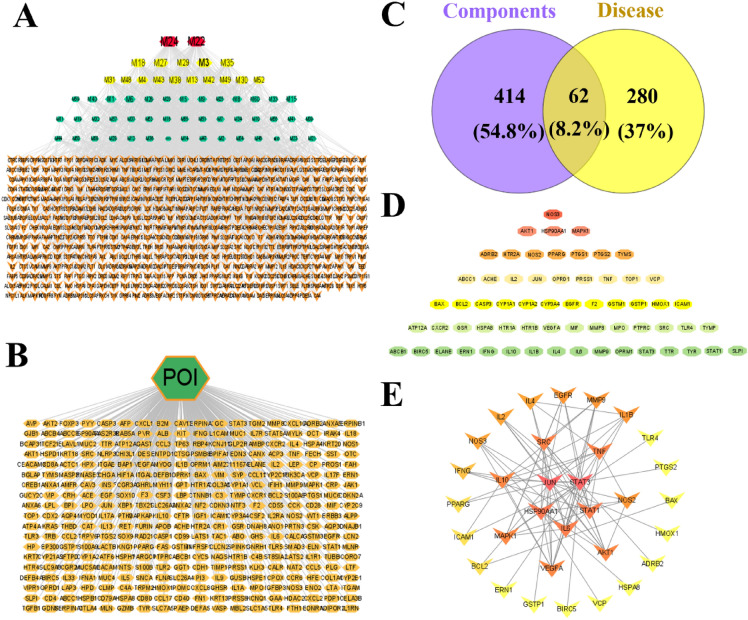
Fig. 4.
The active ingredients-target interactions for KCSG against POI. A The network of connections between active ingredients and targets. The red, yellow, and green nodes represent ingredients in KCSG, while the orange ones represent targets. B Disease-target networks of POI. The green nodes represent POI while the yellow ones represent targets. C The Venn diagram for targets of ingredients and the disease. The purple circle is the KCSG target genes, the yellow circle is the POI target genes. The gray area is the 62 overlap targets. D 62 overlap targets. E PPI network of the KCSG ingredients targets against POI. Network nodes represent proteins, and edges represent the interaction between proteins. The color from yellow/orange/red indicated that the redder the rectangle is, the more important the node is in the PPI network

