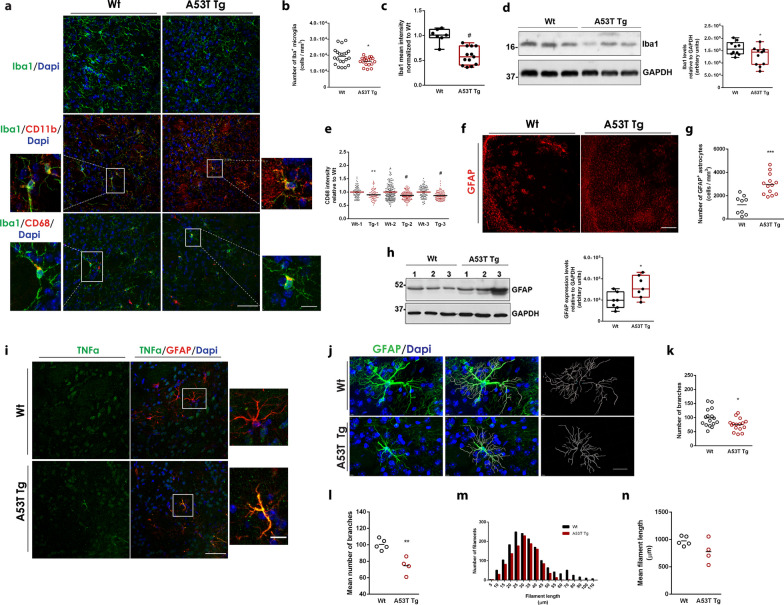
Fig. 3.
A53T microglia and astrocytes exhibit biochemical and morphological alterations. a Representative confocal images of WT and A53T Tg striatal sections stained with antibodies against Iba1, CD11b and CD68. DAPI (blue) was used as a nuclei dye. Scale bar: 50 μm (10 μm for the magnified images). b Quantification of the number of Iba1+ microglia cells (n = 21 and n = 19 images from WT and A53T Tg mice, respectively, #P = 0.0239) upon immunostaining of coronal brain sections in the striatum of WT and A53T Tg mice with an Iba1-specific antibody. c Quantification of the total mean fluorescence intensity of Iba1+ cells (n = 7 and n = 13 images from WT and A53T Tg mice, respectively, #P < 0.0001) stained as above. d Immunoblotting analysis of striatum homogenates from WT and A53T Tg mice using a specific antibody to Iba1 and densitometric quantification (n = 10 and n = 11 for WT and A53T Tg mice, respectively, *P = 0.0438). GAPDH was used as a loading control. e Quantification of the mean fluorescence intensity of CD68 in individual Iba1+ cells in three independent pairs (1, 2, 3) of WT and A53T Tg mice; **P = 0.0018 for pair 1, #P < 0.0001 for pairs 2 and 3, n ≥ 74 astrocytes for each genotype. f Representative confocal images of WT and A53T Tg striatal sections stained with a specific antibody for GFAP. Scale bar, 200 μm. g Quantification of the number of GFAP+ astrocytes in the striatum following immunostaining and confocal imaging (n = 9 and n = 13 images for WT and A53T Tg mice, respectively, ***P = 0.0001). h Western blot and GFAP quantification in striatal homogenates (n = 7 mice per genotype, *P = 0.219). i Representative confocal images of WT and A53T Tg striatal sections stained with specific antibodies for TNFα and GFAP. Scale bar: 50 μm (10 μm for the magnified images). j Representative images of 3D reconstructed GFAP-immunoreactive astrocytes from WT and A53T Tg striatum, using the IMARIS software. DAPI was used for nuclei staining. Scale bar, 20 μm. k, l Quantification of the number of branches; k from 16 astrocytes per genotype, *P = 0.0174, and (l) pre-averaged per animal (n = 5 and n = 4 for WT and A53T Tg mice, respectively, **P = 0.0024). m, n Quantification of filament length; (m) length distribution from 16 astrocytes per genotype and (n) pre-averaged per animal (n = 5 and n = 4 for WT and A53T Tg mice, respectively, P = 0.1058). For all comparisons statistics were performed by unpaired Student’s t test

