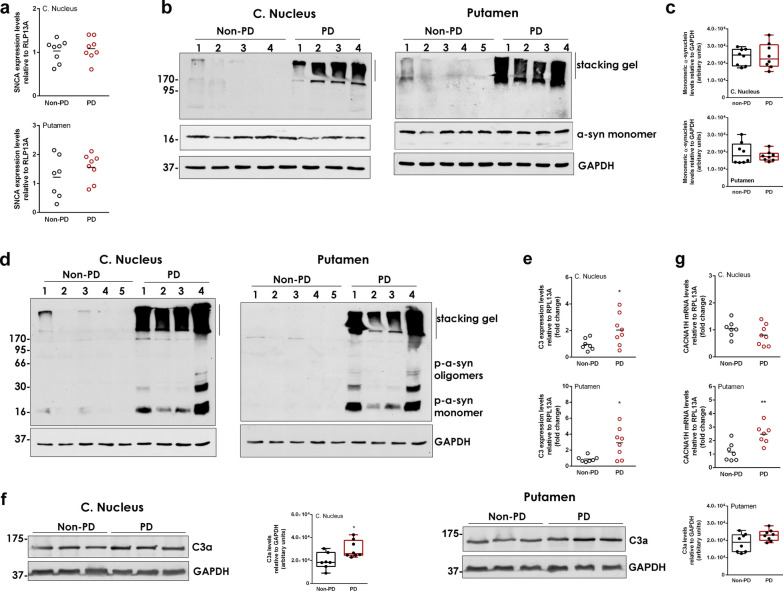
Fig. 8.
Human PD brain is characterized by α-synuclein oligomers, C3 complement activation and altered Cav3.2 mRNA levels. a Comparison of the SNCA mRNA levels in the caudate nucleus (n = 8 per group, P = 0.6926) and putamen tissue (n = 7 Non-PD and n = 8 PD, P = 0.2917) of PD vs non-PD subjects. b Representative western blots depicting oligomeric and monomeric α-synuclein in the two brain areas. c Densitometric quantifications of monomeric α-synuclein in the caudate nucleus, P = 0.8613 and putamen, P = 0.4783 (n = 8 per group per brain area). d Representative western blots depicting phosphorylated oligomeric and monomeric α-synuclein in the two brain areas. e qPCR assessment of C3 mRNA in caudate nucleus, *P = 0.0373 and putamen, *P = 0.0140 (n = 8 per group, per brain area). f Representative western blots showing the levels of C3a in caudate nucleus (n = 7 non-PD and n = 8 PD, *P = 0.0168) and putamen (n = 8 per group, *P = 0.0651). g qPCR assessment of CACNA1H mRNA in caudate nucleus (n = 7 Non-PD and n = 8 PD, P = 0.2184) and putamen (n = 7 per group, **P = 0.0044). In all western blots, GAPDH was used as a loading control. All statistics were performed by unpaired Student’s t test

