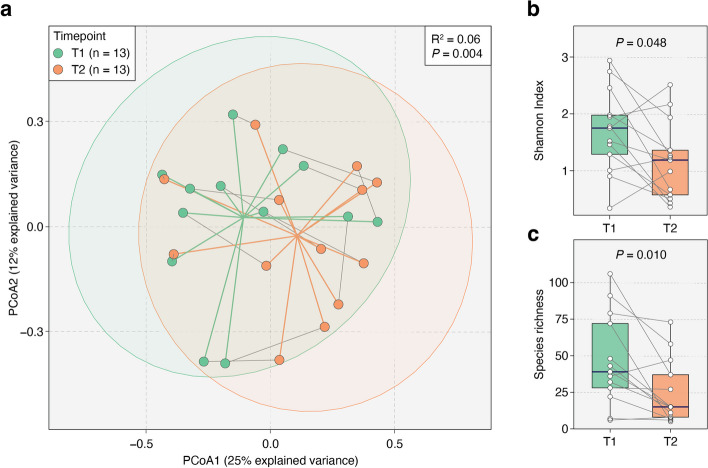
Fig. 3.
Gut microbiome diversity alterations in 13 ICU patients across two timepoints. a Principal coordinate analysis (PCoA) ordination plots of gut microbiome samples from patients at two timepoints (26 total samples). A significant shift in gut microbiome composition between the timepoints was identified by our PERMANOVA analysis (R2 = 0.06, P = 0.004). Points represent samples from T1 (green) and T2 (orange). Gray solid lines connect samples from the same patient, with green and orange lines marking the centroids of T1 and T2 samples, respectively. Ellipses correspond to 95% confidence regions. b, c T2 samples showed significant reductions in both species-level Shannon Index (P = 0.048) and richness (P = 0.010) compared to T1. P-values were obtained using the two-sided Wilcoxon signed-rank test

