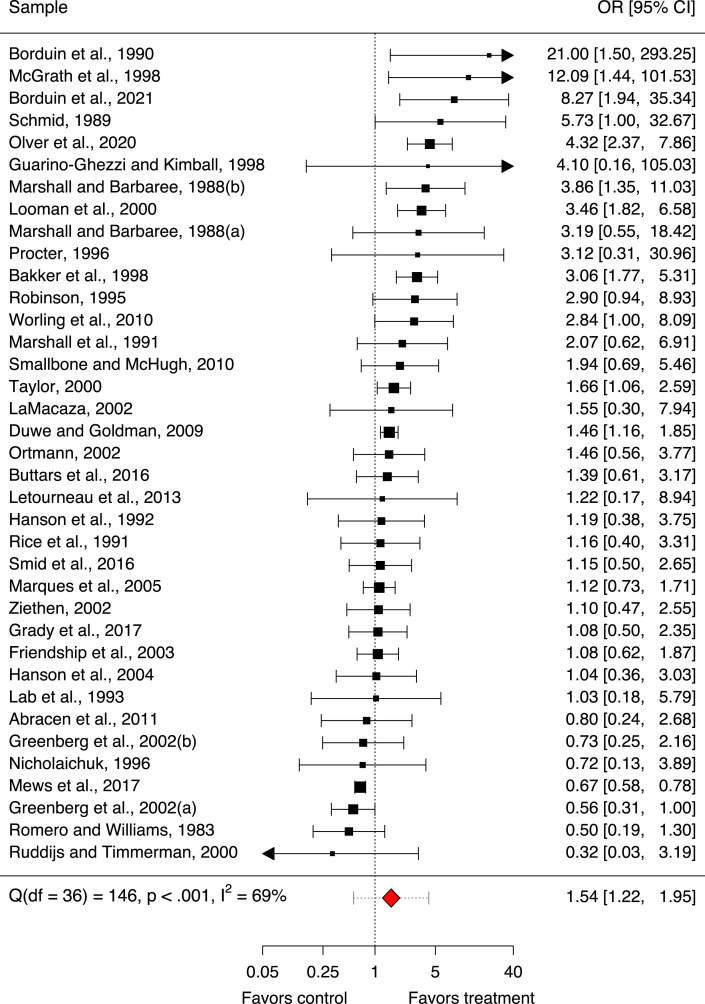
Figure 1.
Forest plot sample-specific effects. Forest plot illustrating the 37 sample-specific odds ratios with 95% confidence intervals (OR [95% CI]) included in the updated meta-analysis with respect to sexual recidivism as an indicator of treatment effectiveness in persons with sexual offense histories. Square size is proportionate to the precision of the sample-specific effect sizes. Arrows indicate CIs extending beyond the axis limits. The red diamond represents the mean treatment effect for sexual recidivism with its 95% CIs given in brackets and its 95% prediction interval ([95% PI]) depicted as dotted interval around the diamond.

