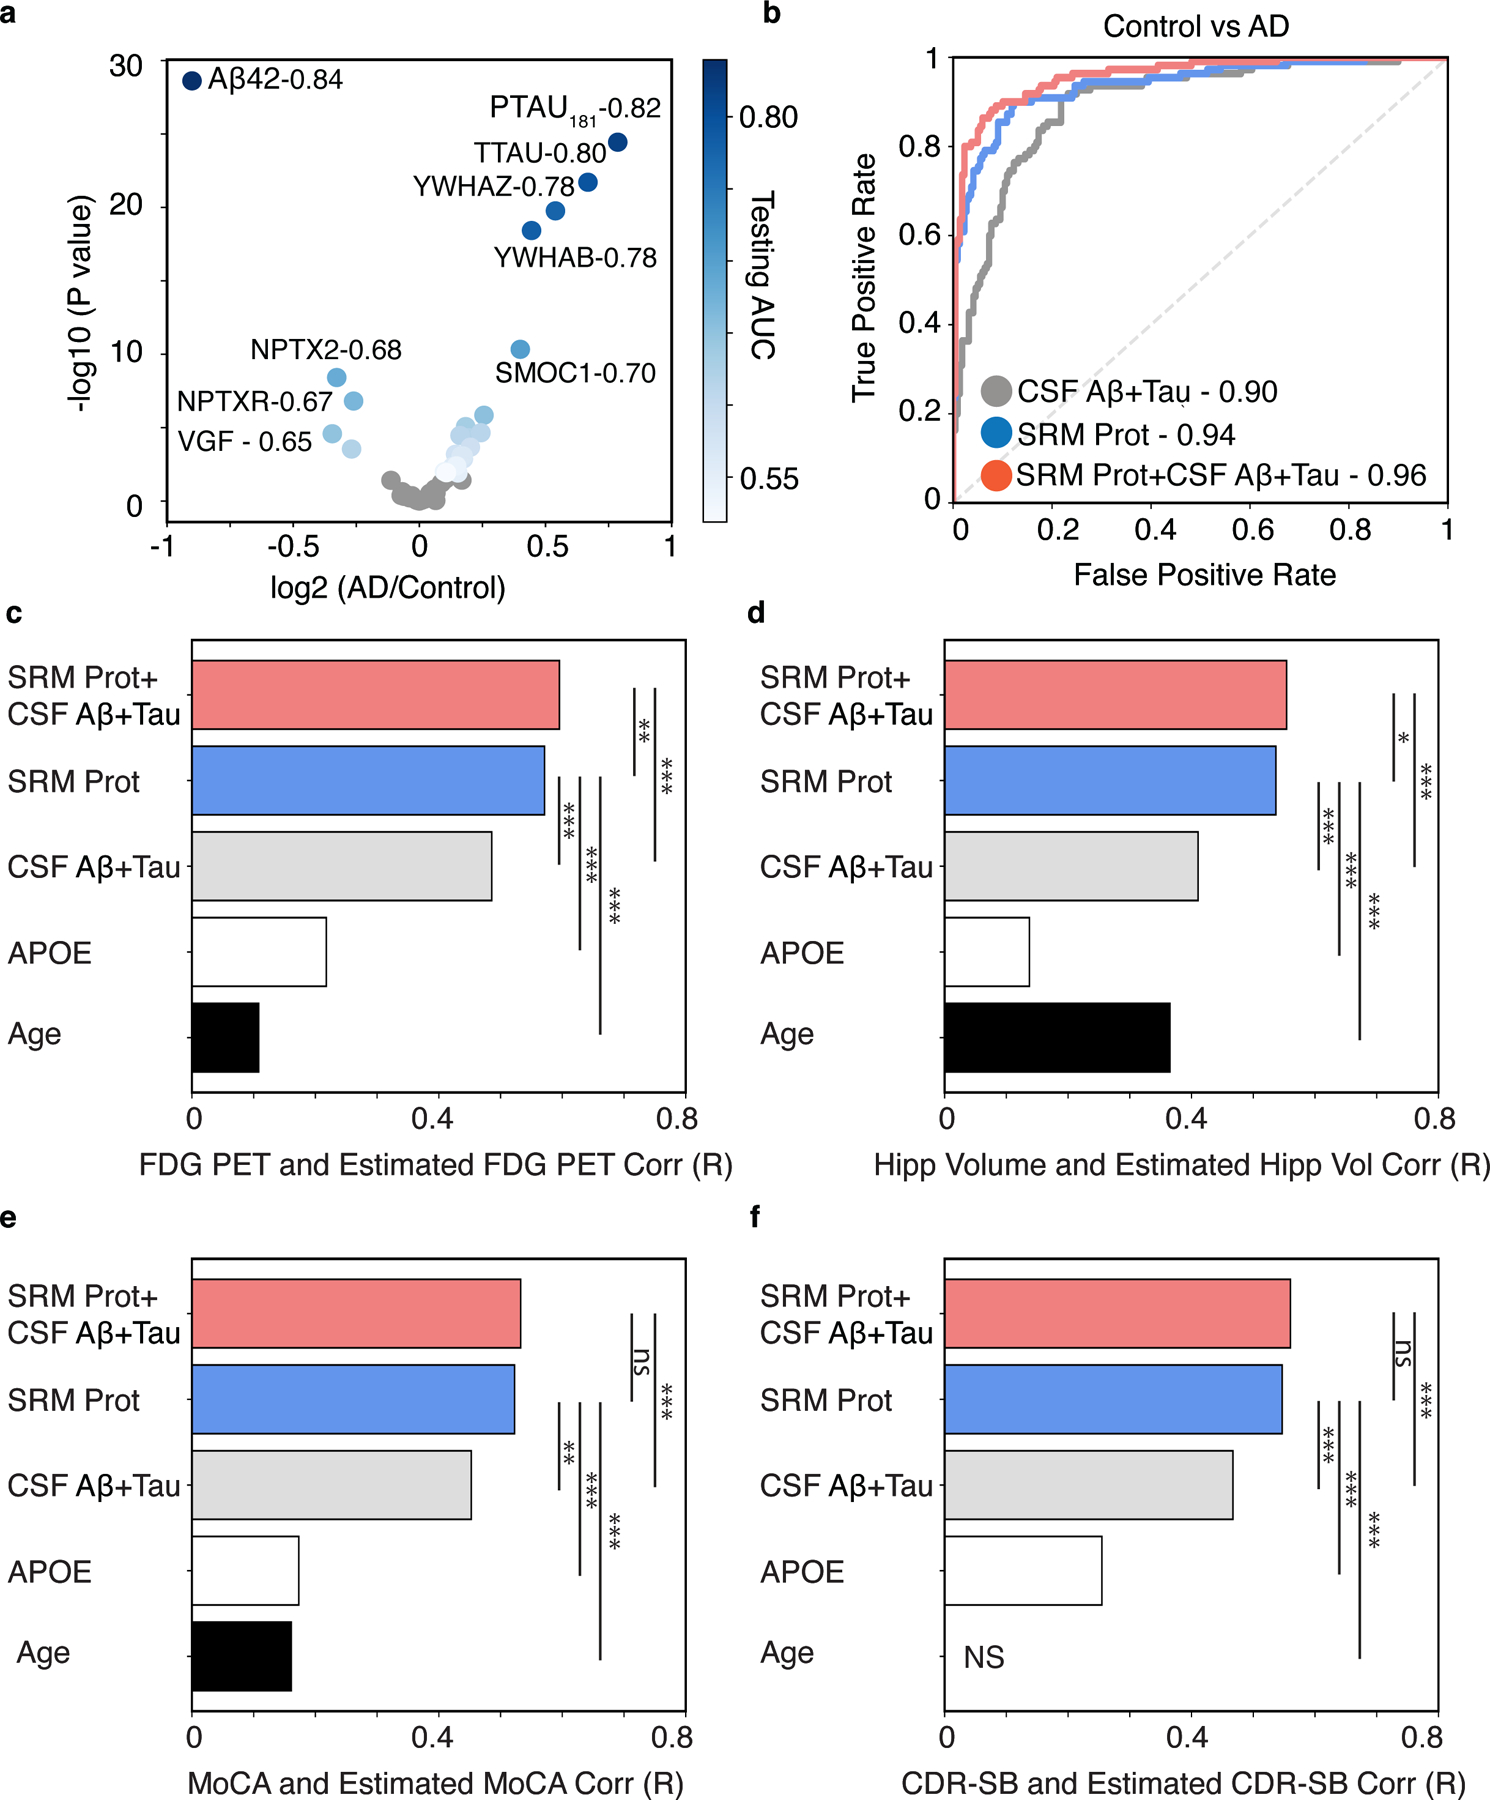
Fig. 1. The CSF 48 panel estimates baseline cognitive FDG PET, hippocampal volume, cognitive status, and dementia severity in ADNI.

(A) Differential association analysis of all CSF analytes for clinical diagnosis of AD versus cognitively normal control. Analytes with FDR-adjusted significant association are shown in shades of blue that reflects their AUC comparing controls to AD dementia. Non-significant proteins are shown in grey (p > 0.05, FDR corrected). B) The cumulative performance of canonical AD CSF biomarkers (“CSF Aβ42+Tau”), the CSF 48 panel (“CSF 48”), and the existing AD CSF biomarkers plus the CSF protein panel (“CSF 48 + CSF Aβ42 + Tau”), estimated as the area under the curve (AUC) for clinical diagnosis of AD versus cognitively normal control. Bar plots show the Pearson correlation coefficients between observed and predicted values of (C) FDG PET, (D) Hippocampal Volume (“Hipp Volume”), (E) Montreal Cognitive Assessment (MoCA), (F) Clinical Dementia Rating scale Sum of Boxes (CDR-SB) for models using the following predictors: 1) the CSF protein panel plus existing AD CSF biomarkers plus (“CSF 48 + CSF Aβ42 + Tau”), 2) the CSF protein panel alone (“CSF 48”), 3) canonical AD CSF biomarkers alone (“CSF Aβ42+Tau”), 4) APOE E4 dose alone, or 5) Age alone. (*p < 0.05, **p < 0.01, ***p < 0.001. FDG-PET n = 703, Hippocampal Volume n = 640, MoCA n = 694, CDR-SB n = 704). NS (non-significant).
