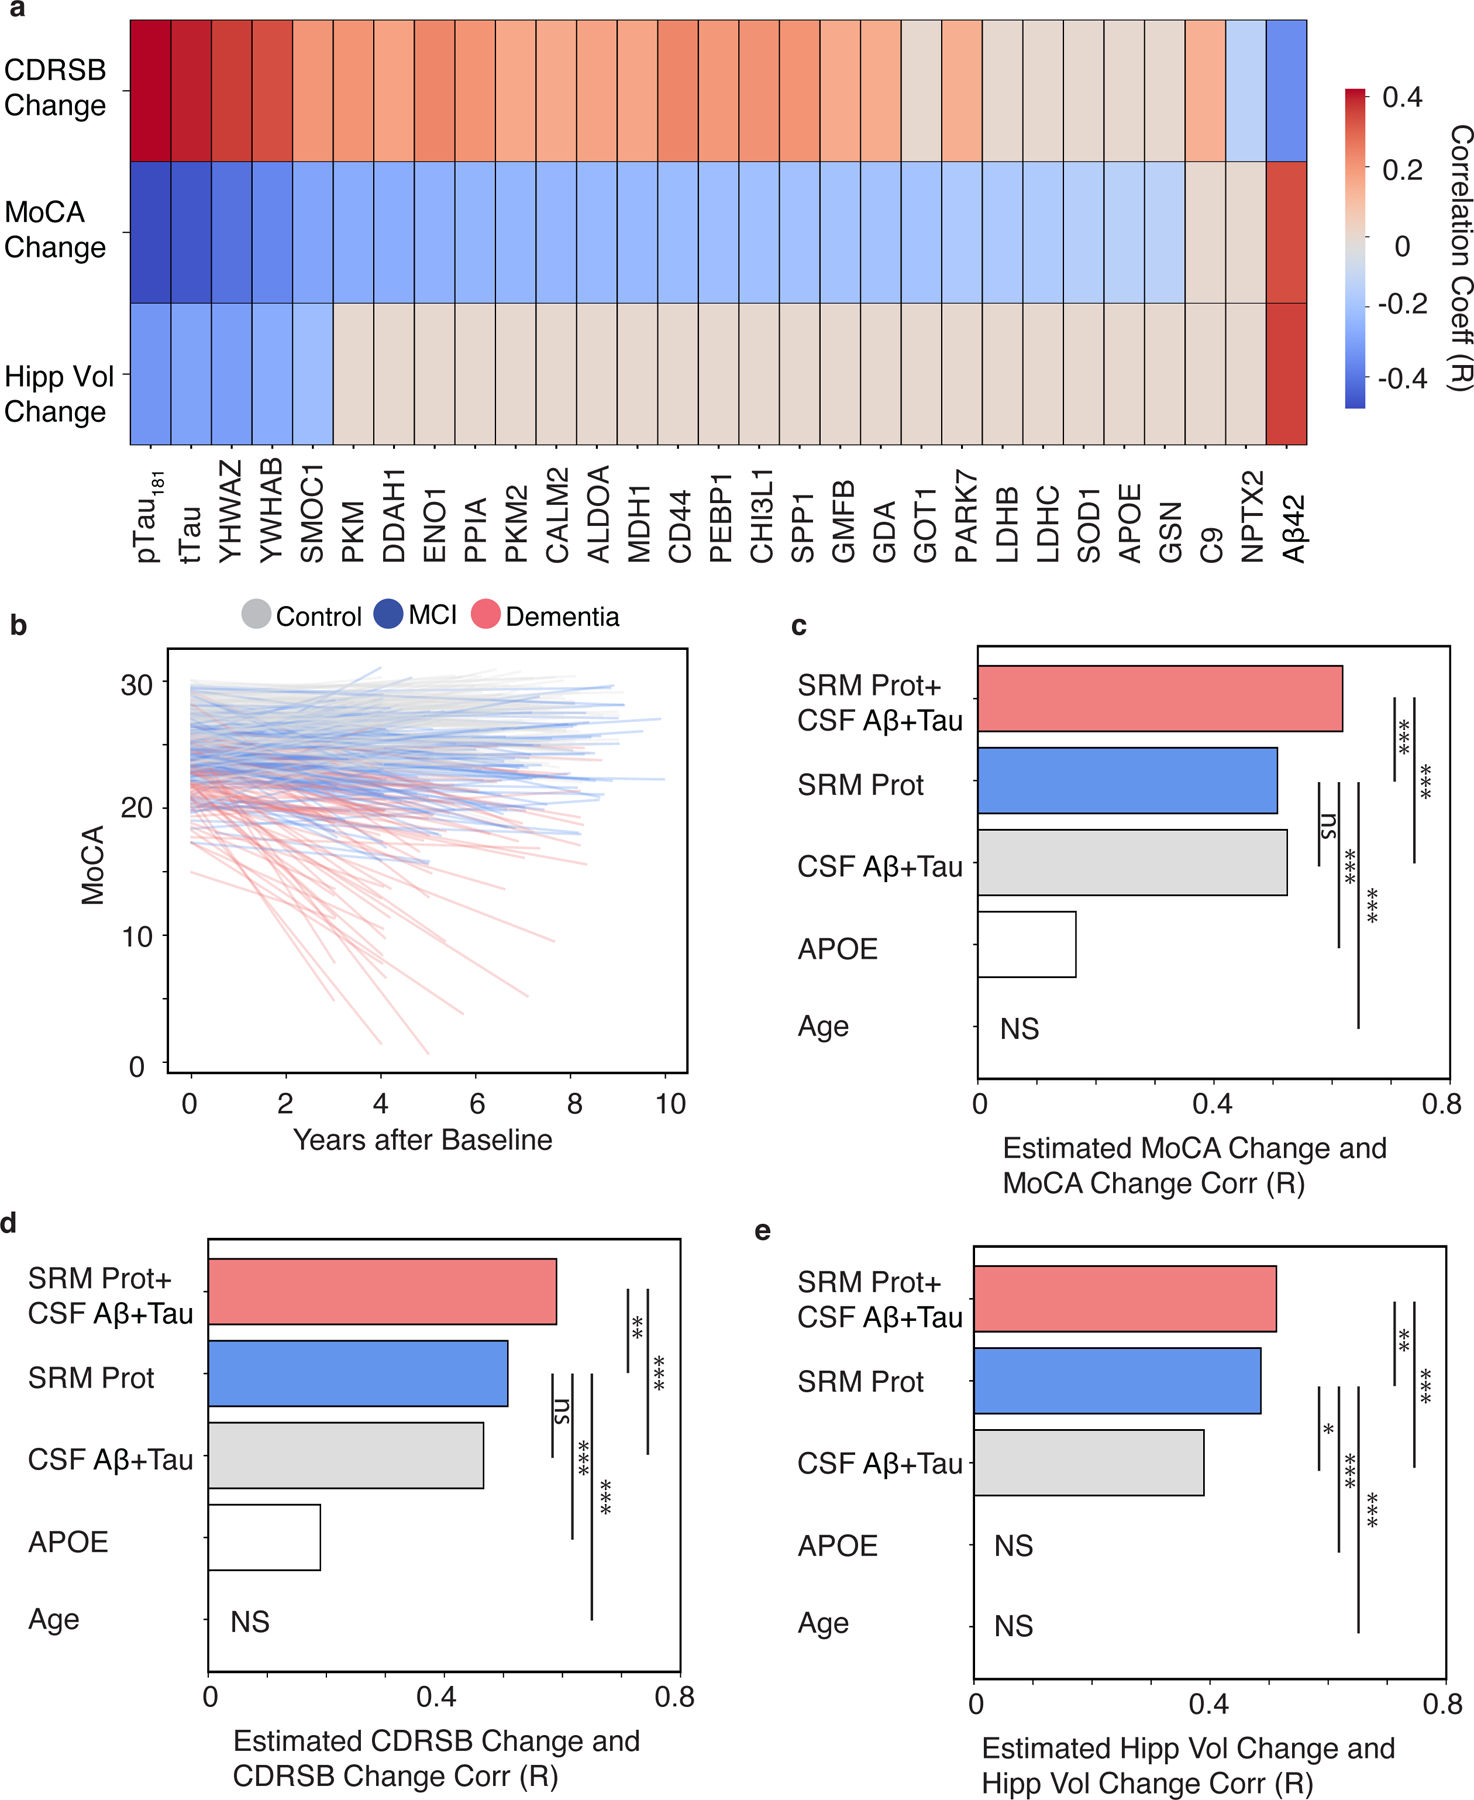
Fig. 2. The CSF 48 panel predicts future change in cognition, dementia severity, and hippocampal volume.

(A) A heatmap of FDR-adjusted Pearson correlations are shown for CSF analytes and change in CDR-SB, MoCA, or hippocampal volume. The CSF peptides are labeled as their respective gene symbols, and the strength and direction of correlation is shown by the red to blue scale and non-significant correlations are shown as grey. (B) Line plot of individual estimates of MoCA decline over time. The color of each line reflects the baseline clinical diagnosis. Bar plots show the Pearson correlation coefficients of between observed and predicted values. (C) MoCA, (D) CDR-SB, or (E) Hippocampal volume for models using the following predictors: 1) the CSF protein panel plus existing AD CSF biomarkers plus (“CSF 48+CSF Aβ42+Tau”), 2) the CSF protein panel alone (“CSF 48”), 3) canonical AD CSF biomarkers alone (“CSF Aβ42+Tau”), 4) APOE E4 dose alone, or 5) Age alone. (*p < 0.05, **p < 0.01, ***p < 0.001. MoCA N=412, CDR-SB n =429, Hippocampal Volume n = 227). NS (non-significant).
