
Fig. 3. The CSF 48 panel estimates amyloid and tau biomarkers.
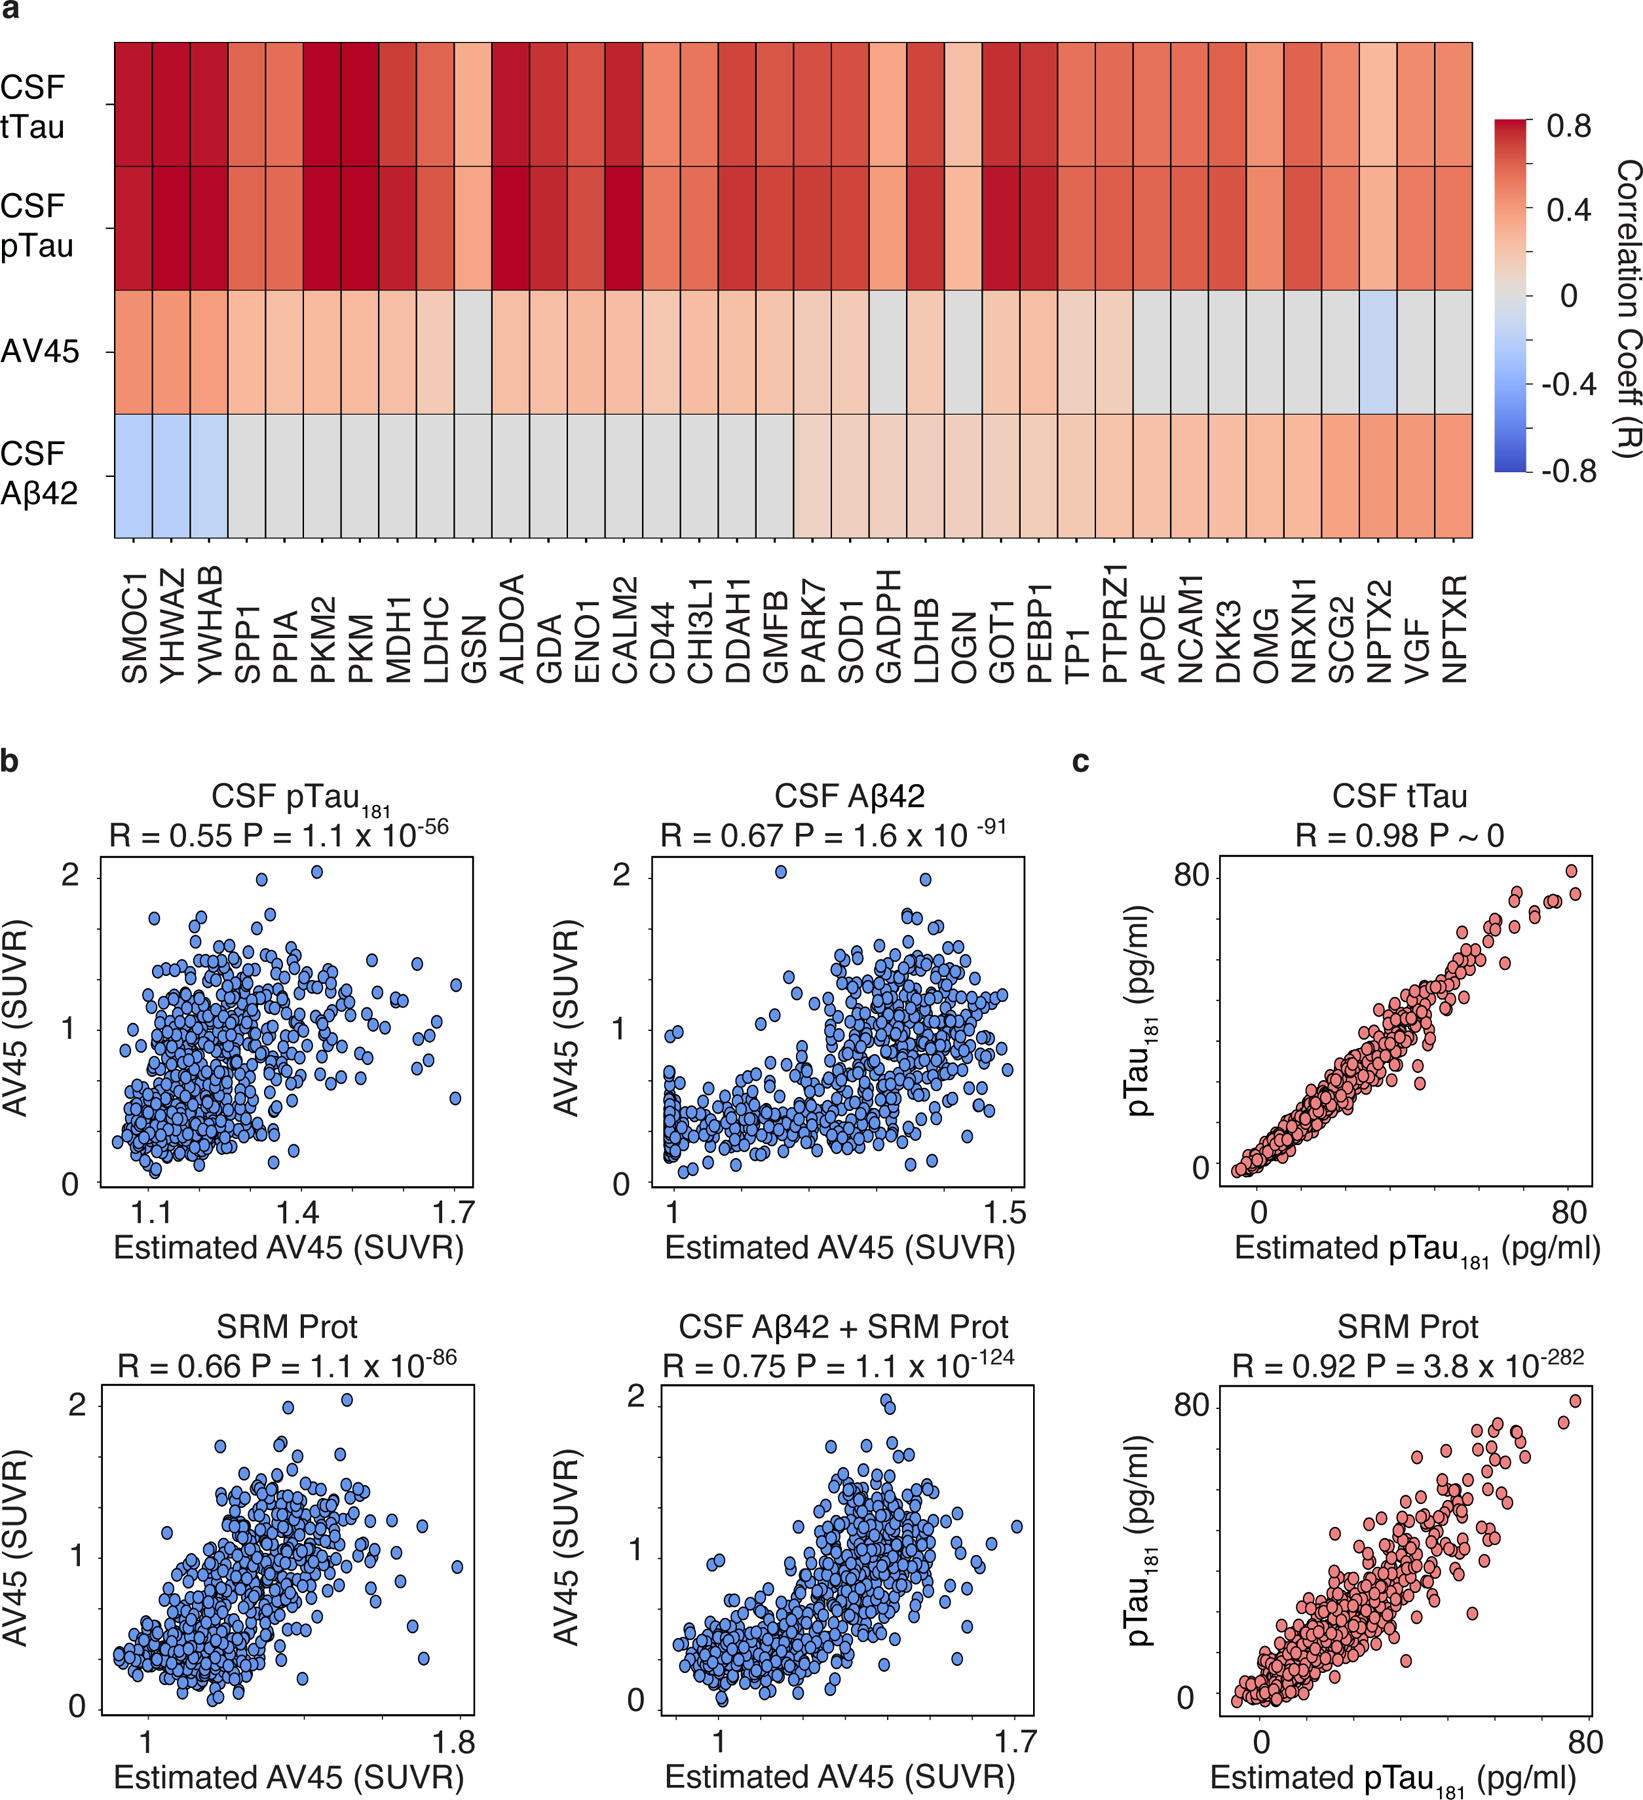
(A) Heatmaps of Pearson correlations are shown for CSF peptides that were significantly associated with one or more of the following outcomes after FDR-adjustment: AV45 SUVR, CSF Aβ42, CSF pTau181, and CSF tTau,. The significant CSF peptides are labeled as their respective gene symbols, and the strength and direction of the correlations are shown by the red to blue scale and non-significant correlations are shown as grey (FDR p < 0.01, t-test ) (B) Scatter plot showing Pearson correlations between the observed and predicated estimate of AV45 SUVR using CSF pTau181 (top left), CSF Aβ42 (top right), the CSF protein panel (“CSF 48”, bottom left), or the CSF protein panel plus CSF Aβ42 (“CSF Aβ42 + CSF 48”, bottom right). (C) Scatter plot showing Pearson correlations between the observed and predicated estimate of CSF pTau181 using either CSF tTau (top) or the CSF protein panel (“CSF 48”, bottom) as predictors.